Quantcast
Channel: Geeks with Blogs
Viewing all 682 articles
Browse latest View live

Useful .NET Delegate Internals

$
0
0

Originally posted on: http://geekswithblogs.net/akraus1/archive/2012/05/20/149699.aspx

Delegates in .NET are a very handy addition to the language. With the introduction of LINQ they did become mainstream and everyone is using them or is at least finding them cool. But what the CLR is really doing to them under the covers remains largely unexplored. This is ok as long as you never get any memory dumps from the field with angry customers waiting for a solution. Delegates are heavily used to e.g. send window messages from an arbitrary thread to the main UI thread. Or you have an thread scheduler (TPL anyone?) which does execute delegates from a queue on one or more threads. These things do all work with a custom data structure where besides scheduling information the delegate to be called is stored. When you want to examine a data structure which does contain delegate fields and you need to know to which method this delegate does point to things become less obvious if you do not have the VS debugger on a live process attached. If you dump the contents of a Func<string,bool> delegate you will see in Windbg something like this:

0:000> !DumpObj /d 0272b8d8
Name:        System.Func`2[[System.String, mscorlib],[System.Boolean, mscorlib]]
MethodTable: 6e4edbac
EEClass:     6e211748
Size:        32(0x20) bytes
File:        C:\Windows\Microsoft.Net\assembly\GAC_32\mscorlib\v4.0_4.0.0.0__b77a5c561934e089\mscorlib.dll
Fields:
      MT    Field   Offset                 Type VT     Attr    Value Name
6e52f744  4000076        4        System.Object  0 instance 0272b8d8 _target  -> Target object to call to
6e52f744  4000077        8        System.Object  0 instance 00000000 _methodBase –> is null except if VS is attached
6e52ab88  4000078        c        System.IntPtr  1 instance   5b0a18 _methodPtr  -> Trampoline code to dispatch the method
6e52ab88  4000079       10        System.IntPtr  1 instance   40c068 _methodPtrAux –> If not null and invocationCount == 0 it does contain the MethodPtr of a static method.
6e52f744  400007a       14        System.Object  0 instance 00000000 _invocationList –> When it is an event there the list of delegates to call are stored
6e52ab88  400007b       18        System.IntPtr  1 instance        0 _invocationCount –> Number of delegates stored in invocationList

We do know the type of the object where one of its methods is called by inspecting the _target field which gives us the instance on which non static methods are called. If the method is static _target does contain only the delegate instance (Func<string,bool>) which is of no help. When a delegate to a static method is declared the value which is normally stored in _methodPtr is stored in _methodPtrAux. This _methodPtrxxxx stuff does not point to data structures but trampolin code that does retrieve the target MethodDescriptor (not via reflection of course). I have found this stuff by creating a little sample app which defines some delegate instances and then goes to sleep to allow me to break into with Windbg quite easy.


using System;using System.Linq;using System.Threading;using System.Runtime.InteropServices;namespace ConsoleApplication10
{class Program
    {staticvoid Main(string[] args)
        {new Program().Start();
        }privatevoid Start()
        {
            Func<string, bool> func = Filter;
            Func<string, bool> staticFunc = FilterStatic;
            Thread.Sleep(5000);
            func("");
        }staticbool FilterStatic(string str)
        {returntrue;
        }bool Filter(string str)
        {thrownew Exception();
        }

The algorithm how the CLR does retrieve the MethodDescriptor when a delegate has been called is the same since .NET 2.0 up to .NET 4.5. There are even no differences between x86 and x64 (except for the pointer size of a MethodDescriptor). The algorithm can best be seen in x64 assembly code how it does retrieve the method descriptor. The _MethodPtr+5 is the base value in eax.


clr!PrecodeFixupThunk+0x1:
000007fe`edf113f1 4c0fb65002      movzx   r10,byte ptr [rax+2] // load byte from eax+2
000007fe`edf113f6 4c0fb65801      movzx   r11,byte ptr [rax+1] // load byte from eax+1
000007fe`edf113fb 4a8b44d003      mov     rax,qword ptr [rax+r10*8+3] // retrieve base MethodDescriptor
000007fe`edf11400 4e8d14d8        lea     r10,[rax+r11*8] // Add method slot offset to get the right one

From this disassembly we can now create a Windbg script to dump for any MethodPtr the actual method.

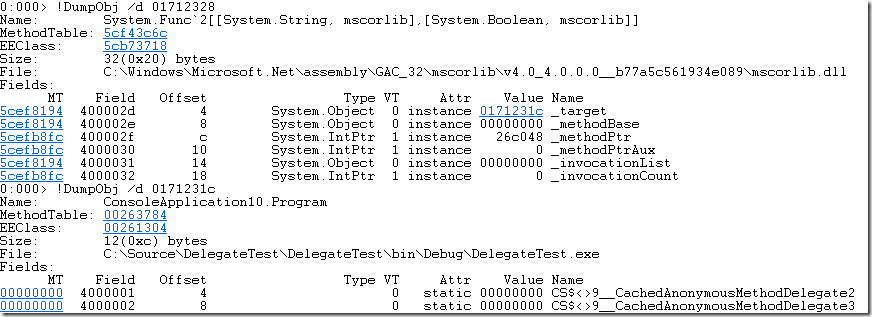
0:000> !DumpObj /d 01ca2328
Name:        System.Func`2[[System.String, mscorlib],[System.Boolean, mscorlib]]
MethodTable: 5cf43c6c
EEClass:     5cb73718
Size:        32(0x20) bytes
File:        C:\Windows\Microsoft.Net\assembly\GAC_32\mscorlib\v4.0_4.0.0.0__b77a5c561934e089\mscorlib.dll
Fields:
      MT    Field   Offset                 Type VT     Attr    Value Name
5cef8194  400002d        4        System.Object  0 instance 01ca231c _target
5cef8194  400002e        8        System.Object  0 instance 00000000 _methodBase
5cefb8fc  400002f        c        System.IntPtr  1 instance   26c048 _methodPtr
5cefb8fc  4000030       10        System.IntPtr  1 instance        0 _methodPtrAux
5cef8194  4000031       14        System.Object  0 instance 00000000 _invocationList
5cefb8fc  4000032       18        System.IntPtr  1 instance        0 _invocationCount
0:000> $$>a< "c:\source\DelegateTest\Resolve.txt" 26c048
Method Name:  ConsoleApplication10.Program.Filter(System.String)
Class:        002612fc
MethodTable:  00263784
mdToken:      06000005
Module:       00262e7c
IsJitted:     yes
CodeAddr:     002c05f0
Transparency: Critical

The code for the Resolve.txt Windbg script is

r $t0 = ${$arg1}+5
r $t1 = $t0 + 8*by($t0+2) + 3
r $t2 = 8*by($t0+1)
r $t3 = poi($t1) + $t2
!DumpMD $t3

This does allow you to retrieve the called method from any delegate instance from .NET 2.0-4.5 regardless of its bitness. The offsets used in the script seem to point to IL structures which have the same layout across all platforms. For x86 code there is a even shorter shortcut. It seems that the two offsets are 0 normally which boils the whole calculation down to

!DumpMD poi(_methodPtr+8)

to get the desired information. For x64 though you need the script to get the right infos back. I have tried to load a dump of the short demo application into VS11 to see if VS can resolve the target methods already (would be a fine thing) but nope you will not get much infos out of the dump if you stick to VS. Windbg still remains the (only) one tool of choice to do post mortem debugging with memory dumps. You can either tell your customers that you did not find the bug and you need to install VS on their machines or you take a deep breath and remove they layers of abstractions (C#, IL, Assembler, … Quantum Physics) one by one until you can solve your problem.

If you try this out and come back to me that this script does not work it could be that you did try to dump the _methodPtr from a multicast delegate which has an invocation count > 0. The _methodPtr does then contain the code to loop through the array and calls them one by one. All you need to do is to use the script on one of the delegates contained in the _invocationList array.


To make Windbg more user friendly you should type as first command always

.prefer_dml 1

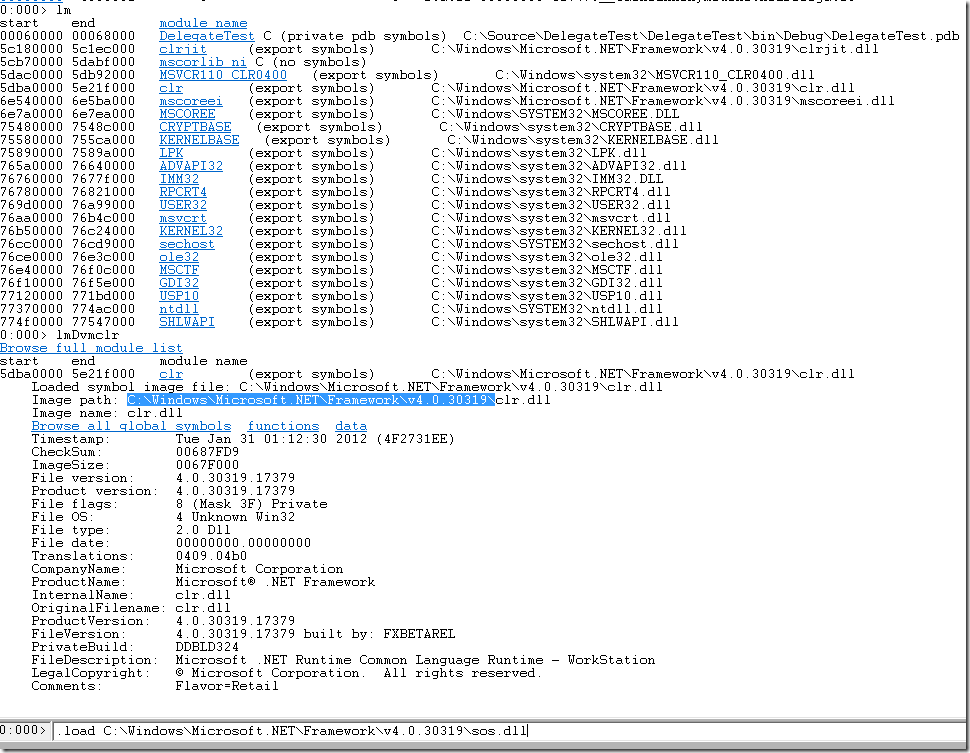
to enable “hyperlink” support for many commands in WinDbg. With .NET 4.0 the sos.dll does also support this hyperlink syntax which makes it much easier to dump the contents of objects. Whenever you click on one of the blue underlined links with the mouse a useful command like dump object contents is executed.


image


When you have this enabled it becomes also easier to load the right sos.dll. Many of you know the trick to use the .loadby command to load the sos dll from the same location as the clr.dll (.NET 4.0) or mscorwks (pre .NET 4.0). For some reasons this loadby trick does not work in all cases. Another nearly as fast solution is to use the lm command to display the loaded modules. When you then click on the module where you want to know the path you can then copy it into your command line and append sos.dll to your load command and you are done.

image

For the ones of you who can remember all shortcuts you can also use

0:000> lm i m clr
Browse full module list
start    end        module name
5dba0000 5e21f000   clr        (export symbols)       C:\Windows\Microsoft.NET\Framework\v4.0.30319\clr.dll

to show the full path of all modules which match clr as pattern.

WMemoryProfiler is Released

$
0
0

Originally posted on: http://geekswithblogs.net/akraus1/archive/2012/06/22/150026.aspx

What is it? WMemoryProfiler is a managed profiling Api to aid integration testing. This free library can get managed heap statistics and memory usage for your own process (remember testing) and other processes as well. The best thing is that it does work from .NET 2.0 up to .NET 4.5 in x86 and x64. To make it more interesting it can attach to any running .NET process. The reason why I do mention this is that commercial profilers do support this functionality only for their professional editions. An normally only since .NET 4.0 since the profiling API only since then does support attaching to a running process.

This thing does differ in many aspects from “normal” profilers because while profiling yourself you can get all objects from all managed heaps back as an object array. If you ever wanted to change the state of an object which does only exist a method local in another thread you can get your hands on it now …

Enough theory. Show me some code

/// <summary>/// Show feature to not only get statisics out of a process but also the newly allocated /// instances since the last call to MarkCurrentObjects./// GetNewObjects does return the newly allocated objects as object array/// </summary>staticvoid InstanceTracking()
        {using (var dumper = new MemoryDumper())  // if you have problems use to see the debugger windows true,true))
            {
                dumper.MarkCurrentObjects();
                Allocate();
                ILookup<Type, object> newObjects = dumper.GetNewObjects()
                                                         .ToLookup( x => x.GetType() );

                Console.WriteLine("New Strings:");foreach (var newStr in newObjects[typeof(string)] )
                {
                    Console.WriteLine("Str: {0}", newStr);
                }
            }
        }

New Strings:
Str: qqd
Str: String data:
Str: String data: 0
Str: String data: 1

This is really hot stuff. Not only you can get heap statistics but you can directly examine the new objects and make queries upon them. When I do find more time I can reconstruct the object root graph from it from my own process. It this cool or what? You can also peek into the Finalization Queue to check if you did accidentally forget to dispose a whole bunch of objects …

/// <summary>/// .NET 4.0 or above only. Get all finalizable objects which are ready for finalization and have no other object roots anymore./// </summary>staticvoid NotYetFinalizedObjects()
        {using (var dumper = new MemoryDumper())
            {object[] finalizable = dumper.GetObjectsReadyForFinalization();
                Console.WriteLine("Currently {0} objects of types {1} are ready for finalization. Consider disposing them before.", 
                                  finalizable.Length,
                                   String.Join(",", finalizable.ToLookup( x=> x.GetType() )
                                                               .Select(   x=> x.Key.Name)) 
                                 );
            }

        }

How does it work?

The W of WMemoryProfiler is a good hint. It does employ Windbg and SOS dll to do the heavy lifting and concentrates on an easy to use Api which does hide completely Windbg. If you do not want to see Windbg you will never see it. In my experience the most complex thing is actually to download Windbg from the Windows 8 Stanalone SDK. This is described in the Readme and the exception you are greeted with if it is missing in much greater detail. So I will not go into this here.


What Next?

Depending on the feedback I do get I can imagine some features which might be useful as well

  • Calculate first order GC Roots from the actual object graph
  • Identify global statics in Types in object graph
  • Support read out of finalization queue of .NET 2.0 as well.
  • Support Memory Dump analysis (again a feature only supported by commercial profilers in their professional editions if it is supported at all)
  • Deserialize objects from a memory dump into a live process back (this would need some more investigation but it is doable)

The last item needs some explanation. Why on earth would you want to do that? The basic idea is to store in your live process some logging/tracing data which can become quite big but since it is never written to it is very fast to generate. When your process crashes with a memory dump you could transfer this data structure back into a live viewer which can then nicely display your program state at the point it did crash. This is an advanced trouble shooting technique I have not seen anywhere yet but it could be quite useful. You can have here a look at the current feature list of WMemoryProfiler with some examples.


How To Get Started?

First I would download the released source package (it is tiny). And compile the complete project. Then you can compile the Example project (it has this name) and uncomment in the main method the scenario you want to check out. If you are greeted with an exception it is time to install the Windows 8 Standalone SDK which is described in great detail in the exception text.

image

Thats it for the first round. I have seen something more limited in the Java world some years ago (now I cannot find the link anymore) but anyway. Now we have something much better.

The Truth About .NET Objects And Sharing Them Between AppDomains

$
0
0

Originally posted on: http://geekswithblogs.net/akraus1/archive/2012/07/25/150301.aspx

I have written already some time ago how big a .NET object is. John Skeet as also made a very detailed post about object sizes in .NET. I wanted to know if we can deduce the object size not by experiments (measuring) but by looking at the Rotor source code. There is indeed a simple definition in the object headers how big a .NET object minimally can be. A CLR object is still a (sophisticated) structure which is at an address that is changed quite often by the garbage collector.

image

The picture above shows that every .NET object contains an object header which contains information about which thread in which AppDomain has locked the object (means called Monitor.Enter). Next comes the Method Table Pointer which defines a managed type for one AppDomain. If the assembly is loaded AppDomain neutral this pointer to the type object will have the same value in all AppDomains. This basic building block of the CLR type system is also visible in managed code via Type.TypeHandle.Value which has IntPtr size.


\sscli20\clr\src\vm\object.h

//// The generational GC requires that every object be at least 12 bytes// in size.   #define MIN_OBJECT_SIZE     (2*sizeof(BYTE*) + sizeof(ObjHeader))

A .NET object has basically this layout:

class Object
{protected:
    MethodTable*    m_pMethTab;

};
class ObjHeader
{private:// !!! Notice: m_SyncBlockValue *MUST* be the last field in ObjHeader.
    DWORD  m_SyncBlockValue;      // the Index and the Bits
};


For x86 the minimum size is therefore 12 bytes = 2*4+4. And for x64 it is 24 bytes = 2*8+8. The ObjectHeader struct is padded with another 4 bytes in x64 which does add up to 24 bytes for every object instance. The MIN_OBJECT_SIZE definition has actually a factor two inside it whereas we would expect 8 as minimum empty object size. The previous sentence does contain already the answer to it. It makes little sense to define empty objects. Most meaningful objects have at least one member variable of class type which is indeed another pointer sized member hence the minimum size of 12 bytes (24) bytes in x86/x64.

It is interesting to know that the garbage collector does not know anything about AppDomains. For him the managed heap does only consist of objects which have roots or not and does clean up everything which is not rooted anymore. I found this during the development of WMemoryProfiler which uses DumpHeap of Windbg to get all object references from the managed heap. When I did access all objects found this way I got actually objects from other AppDomains as well. And they did work! It is therefore possible to share objects directly between AppDomains.

Why would you want to do that? Well it is fun and you can do really dirty stuff with that. Do you remember that you cannot unload assemblies from an AppDomain? Yes that is still true but why would you ever want to unload an assembly? Mostly because you were doing some dynamic code generation which will at some point in time dominate your overall memory consumption if you load generated assemblies into your AppDomain. I have seen this stuff many times for dynamic query generation. The problem is that if you load the dynamically created code into another AppDomain you need to serialize the data to the other AppDomain as well because you cannot share plain objects between AppDomains. To serialize potentially much data across AppDomain is prohibitively slow and therefore people live with the restriction that code gen will increase the working set quite a lot.  With some tricks you can now share plain objects between AppDomain and get unloadable code as well.


Warning: This following stuff well beyond the specs but it does work since .NET 2.0 up to 4.5.
Do not try this at work!


When you load an assembly into your (default) AppDomain you will load it only for your current AppDomain. The types defined there are not shared anywhere. There is one exception though: The types defined in mscorlib are always shared between all AppDomains. The mscorlib assembly is loaded into a so called Shared Domain. This is not a real AppDomain but simply a placeholder domain where all assemblies are loaded which can be shared between AppDomains. An assembly loaded into the Shared Domain is loaded therefore AppDomain neutral. Assemblies loaded AppDomain neutral have one special behavior:

  • AppDomain neutral assemblies are never unloaded even when no “real” AppDomain is using them anymore.

The picture below shows in which scenarios assemblies are loaded AppDomain neutral (green) from the Shared Domain.

image

The first one is the most common one. You load an assembly into the default AppDomain. This defaults to LoaderOptimization.SingleAppDomain where every assembly is compiled from scratch again when other AppDomains with no special flags are created. Only the basic CLR types located in mscorlib are loaded AppDomain neutral and always shared between AppDomains no matter what (with .NET 1.1 this was not the case) flags are used.

If you create e.g. 5 AppDomains with the default settings you will load and JIT every assembly (except mscorlib) again and get different types for each AppDomain although the were all loaded from the same assembly in the same loader context.


The opposite is LoaderOptimization.MultiDomain where every assembly is loaded as AppDomain neutral assembly which ensures that all assemblies loaded in any AppDomain which have this attribute set are loaded and JITed only once and share the types (=Same Method Table pointer) between AppDomains.


An interesting hybrid is LoaderOptimization.MultiDomainHost which does load only these assemblies AppDomain neutral which are loaded from the GAC. That means if you load the same assembly one time from the GAC and a second time the same one unsigned from your probing path you will not get identical types but different Method Table pointers for the types.


Since we know that the GC does not know anything about AppDomains we (at least the managed heap objects do not contain infos in which AppDomain they reside) we should be able to pass object via a pointer to another AppDomain. This could come in handy if we generate a lot of code dynamically for each query which is made against a data source but we want a way to get rid of the compiled code by unloading the Query AppDomain from time to time without the normally required cost to copy the data to be queried every time from the Default AppDomain into the Query AppDomain.

image

You can see this in action in the sample Application AppDomainTests which is part of the test suite for WMemoryProfiler. Here is the code for the main application which does create AppDomains in a loop send data via an IntPtr to another AppDomain and get the calculated result back without passing the data via Marshalling by value to the other AppDomain.

class Program
    {/// <summary>/// Show how to pass an object by reference directly into another appdomain without serializing it at all./// </summary>/// <param name="args"></param>
        [LoaderOptimization(LoaderOptimization.MultiDomainHost)]staticpublicvoid Main(string[] args)
        {for (int i = 0; i < 10000; i++) // try it often to see how the AppDomains do behave
            { // To load our assembly appdomain neutral we need to use MultiDomainHost on our hosting and child domain// If not we would get different Method tables for the same types which would result in InvalidCastExceptions// for the same type.// Prerequisite for MultiDomainHost is that the assembly we share the data is // a) Installed into the GAC (which requires as strong name as well)// If you would use MultiDomain then it would work but all AppDomain neutral assemblies will never be unloaded.
            var other = AppDomain.CreateDomain("Test"+i.ToString(), AppDomain.CurrentDomain.Evidence, new AppDomainSetup
                {
                    LoaderOptimization = LoaderOptimization.MultiDomainHost,
                });// Create gate object in other appdomain
            DomainGate gate = (DomainGate)other.CreateInstanceAndUnwrap(Assembly.GetExecutingAssembly().FullName, typeof(DomainGate).FullName);// now lets create some data
            CrossDomainData data = new CrossDomainData();
            data.Input = Enumerable.Range(0, 10).ToList();// process it in other AppDomain
            DomainGate.Send(gate, data);// Display result calculated in other AppDomain
            Console.WriteLine("Calculation in other AppDomain got: {0}", data.Aggregate);

            AppDomain.Unload(other);
            // check in debugger now if UnitTests.dll has been unloaded.
            Console.WriteLine("AppDomain unloaded");

            }
        }

To enable code unloading in the other AppDomain I did use LoaderOptimzation.MultiDomainHost which forces all non GAC assemblies to be unloadable. At the same time we must ensure that the assembly that defines CrossDomainData is loaded from the GAC to get an equal MethodTable pointer accross all AppDomains. The actual magic does happen in the DomainGate class which has a method DoSomething which expects not a CLR object but the object address as parameter to weasel a plain CLR reference into another AppDomain. This sounds highly dirty and it certainly is but it is also quite cool ;-).


/// <summary>/// Enables sharing of data between appdomains as plain objects without any marsalling overhead./// </summary>class DomainGate : MarshalByRefObject
    {/// <summary>/// Operate on a plain object which is shared from another AppDomain./// </summary>/// <param name="gcCount">Total number of GCs</param>/// <param name="objAddress">Address to managed object.</param>publicvoid DoSomething(int gcCount, IntPtr objAddress)
        {if (gcCount != ObjectAddress.GCCount)
            {thrownew NotSupportedException("During the call a GC did happen. Please try again.");
            }// If you get an exception here disable under Projces/Debugging/Enable Visual Studio Hosting Process// The appdomain which is used there seems to use LoaderOptimization.SingleDomain
            CrossDomainData data = (CrossDomainData) PtrConverter<Object>.Default.ConvertFromIntPtr(objAddress);;// process input data from other domainforeach (var x in data.Input)
            {
                Console.WriteLine(x);
            }

            OtherAssembliesUsage user = new OtherAssembliesUsage();// generate output data 
            data.Aggregate = data.Input.Aggregate((x, y) => x + y);
        }publicstaticvoid Send(DomainGate gate, object o)
        {
            var old = GCSettings.LatencyMode;try
            {
                GCSettings.LatencyMode = GCLatencyMode.Batch; // try to keep the GC out of our stuff
                var addandGCCount = ObjectAddress.GetAddress(o);
                gate.DoSomething(addandGCCount.Value, addandGCCount.Key);
            }finally
            {
                GCSettings.LatencyMode = old;
            }

        }

 
    }

To get an object address I use Marshal.UnsafeAddrOfPinnedArrayElement and then try to work around the many race conditions this does impose. But it is not as bad is it sounds since you do need only to pass an object via a pointer once into the other AppDomain and use this as data gateway to exchange input and output data. This way you can pass data via a pointer to another AppDomain which can be fully unloaded after you are done with it. To make the code unloadable I need to use LoadOptimization.MultiDomainHost for all AppDomains. The data exchange type is located in another assembly which is strong named and you need to put it into the GAC before you let the sample run. Otherwise it will fail with this exception

Unhandled Exception: System.InvalidCastException: [A]AppDomainTests.CrossDomainData cannot be cast to [B]AppDomainTests.CrossDomainData. Type A originates from 'StrongNamedDomainGateDll, Version=1.0.0.0, Culture=neutral, PublicKeyToken=98f280cda3cbf035' in the context 'Default' at location 'C:\Source\WindbgAuto\bin\AnyCPU\Release\StrongNamedDomainGateDll.dll'. Type B originates from 'StrongNamedDomainGateDll, Version=1.0.0.0, Culture=neutral, PublicKeyToken=98f280cda3cbf035' in the context 'Default' at location 'C:\Source\WindbgAuto\bin\AnyCPU\Release\StrongNamedDomainGateDll.dll'.
   at AppDomainTests.DomainGate.DoSomething(Int32 gcCount, IntPtr objAddress) in C:\Source\WindbgAuto\Tests\AppDomainTests\DomainGate.cs:line 24
   at AppDomainTests.DomainGate.DoSomething(Int32 gcCount, IntPtr objAddress)
   at AppDomainTests.DomainGate.Send(DomainGate gate, Object o) in C:\Source\WindbgAuto\Tests\AppDomainTests\DomainGate.cs:line 50
   at AppDomainTests.Program.Main(String[] args) in C:\Source\WindbgAuto\Tests\AppDomainTests\Program.cs:line 41

at first it looks a little pointless to deny a cast to an object which was loaded in the default loader context for the very same assembly. But we do know now that the Method Table pointer for CrossDomainData is different between the two AppDomains. When you install the assembly into the GAC (be sure to use the .NET 4 gacutil!) the error goes away and we then get:

0
1
2
3
4
5
6
7
8
9
Calculation in other AppDomain got: 45

which shows that we can get data and are able to modify it directly between AppDomains. If you use this code in production and it does break. I have warned you. This is far beyond what the MS engineers want us to do and it can break the CLR in subtle unintended ways I have not found yet. Now you have got (hopefully) a much better understanding how the CLR type system and the managed heap does work. If questions are left. Start the application and look at !DumpDomain and !DumpHeap –stat and its related commands to see for yourself.

Thread.Interrupt Is Evil

$
0
0

Originally posted on: http://geekswithblogs.net/akraus1/archive/2012/10/22/151047.aspx

Recently I have found an interesting issue with Thread.Interrupt during application shutdown. Some application was crashing once a week and we had not really a clue what was the issue. Since it happened not very often it was left as is until we have got some memory dumps during the crash. A memory dump usually means WindDbg which I really like to use (I know I am one of the very few fans of it).  After a quick analysis I did find that the main thread already had exited and the thread with the crash was stuck in a Monitor.Wait. Strange Indeed. Running the application a few thousand times under the debugger would potentially not have shown me what the reason was so I decided to do what I call constructive debugging. With constructive I mean that I do not try to analyze the running application and try to repro it there. Instead I try to create a synthetic sample application which tries to reproduce the issue. I am done when I get the same crash and callstack as in the production application. This approach is usually quite successful.

I did create a simple Console application project and try to simulate the exact circumstances when the crash did happen from the information I have via memory dump and source code reading. The thread that was  crashing was actually MS code from an old version of the Microsoft Caching Application Block. From reading the code I could conclude that the main thread did call the Dispose method on the CacheManger class which did call Thread.Interrupt on the cache scavenger thread which was just waiting for work to do.

My first version of the repro looked like this


staticvoid Main(string[] args)
    {
        Thread t = new Thread(ThreadFunc)
        {
            IsBackground = true,
            Name = "Test Thread"
        };
        t.Start();

        Console.WriteLine("Interrupt Thread");
        t.Interrupt();
    }staticvoid ThreadFunc()
    {while (true)
        {objectvalue = Dequeue(); // block until unblocked or awaken via ThreadInterruptedException
        }
    }staticobject WaitObject = newobject();staticobject Dequeue()
    {object lret = "got value";try
        {lock (WaitObject)
            {
            }
        }catch (ThreadInterruptedException)
        {
            Console.WriteLine("Got ThreadInterruptException");
            lret = null;
        }return lret;
    }

I do start a background thread and call Thread.Interrupt on it and then directly let the application terminate. The thread in the meantime does plenty of Monitor.Enter/Leave calls to simulate work on it. This first version did not crash. So I need to dig deeper. From the memory dump I did know that the finalizer thread was doing just some critical finalizers which were closing file handles. Ok lets add some long running finalizers to the sample.

class FinalizableObject : CriticalFinalizerObject
{
    ~FinalizableObject()
    {
        Console.WriteLine("Hi we are waiting to finalize now and block the finalizer thread for 5s.");
        Thread.Sleep(5000);
    }
}class Program
{staticvoid Main(string[] args)
    {
        FinalizableObject fin = new FinalizableObject();
        Thread t = new Thread(ThreadFunc)
        {
            IsBackground = true,
            Name = "Test Thread"
        };
        t.Start();

        Console.WriteLine("Interrupt Thread");
        t.Interrupt();
        GC.KeepAlive(fin); // prevent finalizing it too early// After leaving main the other thread is woken up via Thread.Abort// while we are finalizing. This causes a stackoverflow in the CLR ThreadAbortException handling at this time.
    }

With this changed Main method and a blocking critical finalizer I did get my crash just like the real application. The funny thing is that this is actually a CLR bug. When the main method is left the CLR does suspend all threads except the finalizer thread and declares all objects as garbage. After the normal finalizers were called the critical finalizers are executed to e.g. free OS handles (usually). Remember that I did call Thread.Interrupt as one of the last methods in the Main method. The Interrupt method is actually asynchronous and does wake a thread up and throws a ThreadInterruptedException only once unlike Thread.Abort which does rethrow the exception when an exception handling clause is left.

It seems that the CLR does not expect that a frozen thread does wake up again while the critical finalizers are executed. While trying to raise a ThreadInterrupedException the CLR goes down with an stack overflow. Ups not so nice. Why has this nobody noticed for years is my next question. As it turned out this error does only happen on the CLR for .NET 4.0 (x86 and x64). It does not show up in earlier or later versions of the CLR.

I have reported this issue on connect here but so far it was not confirmed as a CLR bug. But I would be surprised if my console application was to blame for a stack overflow in my test thread in a Monitor.Wait call.

What is the moral of this story? Thread.Abort is evil but Thread.Interrupt is too. It is so evil that even the CLR of .NET 4.0 contains a race condition during the CLR shutdown. When the CLR gurus can get it wrong the chances are high that you get it wrong too when you use this constructs. If you do not believe me see what Patrick Smacchia does blog about Thread.Abort and List.Sort. Not only the CLR creators can get it wrong. The BCL writers do sometimes have a hard time with correct exception handling as well. If you do tell me that you use Thread.Abort frequently and never had problems with it I do suspect that you do not have looked deep enough into your application to find such sporadic errors.

Do Not Optimize Without Measuring

$
0
0

Originally posted on: http://geekswithblogs.net/akraus1/archive/2012/10/27/151086.aspx

Recently I had to do some performance work which included reading a lot of code. It is fascinating with what ideas people come up to solve a problem. Especially when there is no problem. When you look at other peoples code you will not be able to tell if it is well performing or not by reading it. You need to execute it with some sort of tracing or even better under a profiler. The first rule of the performance club is not to think and then to optimize but to measure, think and then optimize. The second rule is to do this do this in a loop to prevent slipping in bad things for too long into your code base. If you skip for some reason the measure step and optimize directly it is like changing the wave function in quantum mechanics. This has no observable effect in our world since it does represent only a probability distribution of all possible values. In quantum mechanics you need to let the wave function collapse to a single value. A collapsed wave function has therefore not many but one distinct value. This is what we physicists call a measurement.

If you optimize your application without measuring it you are just changing the probability distribution of your potential performance values. Which performance your application actually has is still unknown. You only know that it will be within a specific range with a certain probability. As usual there are unlikely values within your distribution like a startup time of 20 minutes which should only happen once in 100 000 years. 100 000 years are a very short time when the first customer tries your heavily distributed networking application to run over a slow WIFI network…

What is the point of this? Every programmer/architect has a mental performance model in his head. A model has always a set of explicit preconditions and a lot more implicit assumptions baked into it. When the model is good it will help you to think of good designs but it can also be the source of problems. In real world systems not all assumptions of your performance model (implicit or explicit) hold true any longer. The only way to connect your performance model and the real world is to measure it. In the WIFI example the model did assume a low latency high bandwidth LAN connection. If this assumption becomes wrong the system did have a drastic change in startup time.

Lets look at a example. Lets assume we want to cache some expensive UI resource like fonts objects. For this undertaking we do create a Cache class with the UI themes we want to support. Since Fonts are expensive objects we do create it on demand the first time the theme is requested.

A simple example of a Theme cache might look like this:

using System;using System.Collections.Generic;using System.Drawing;struct Theme
{public Color Color;public Font Font;
}staticclass ThemeCache
{static Dictionary<string, Theme> _Cache = new Dictionary<string, Theme>
    {
        {"Default", new Theme { Color = Color.AliceBlue }},
        {"Theme12", new Theme { Color = Color.Aqua }},
    };publicstatic Theme Get(string theme)
    {
        Theme cached = _Cache[theme];if (cached.Font == null)
        {
            Console.WriteLine("Creating new font");
            cached.Font = new Font("Arial", 8);
        }return cached;
    }

}

class Program
{staticvoid Main(string[] args)
    {
        Theme item = ThemeCache.Get("Theme12");
        item = ThemeCache.Get("Theme12");
    }
}

This cache does create font objects only once since on first retrieve of the Theme object the font is added to the Theme object. When we let the application run it should print “Creating new font” only once. Right?

Wrong!

The vigilant readers have spotted the issue already. The creator of this cache class wanted to get maximum performance. So he decided that the Theme object should be a value type (struct) to not put too much pressure on the garbage collector.

The code

Theme cached = _Cache[theme];if (cached.Font == null)
        {
            Console.WriteLine("Creating new font");
            cached.Font = new Font("Arial", 8);
        }

does work with a copy of the value stored in the dictionary. This means we do mutate a copy of the Theme object and return it to our caller. But the original Theme object in the dictionary will have always null for the Font field! The solution is to change the declaration of struct Theme to class Theme or to update the theme object in the dictionary. Our cache as it is currently is actually a non caching cache. The funny thing was that I found out with a profiler by looking at which objects where finalized. I found way too many font objects to be finalized. After a bit debugging I found the allocation source for Font objects was this cache. Since this cache was there for years it means that

  • the cache was never needed since I found no perf issue due to the creation of font objects.
  • the cache was never profiled if it did bring any performance gain.
  • to make the cache beneficial it needs to be accessed much more often.

That was the story of the non caching cache. Next time I will write something something about measuring.

Performance Optimization – It Is Faster When You Can Measure It

$
0
0

Originally posted on: http://geekswithblogs.net/akraus1/archive/2012/11/30/151407.aspx

Performance optimization in bigger systems is hard because the measured numbers can vary greatly depending on the measurement method of your choice. To measure execution timing of specific methods in your application you usually use

Time Measurement MethodPotential Pitfalls
StopwatchMost accurate method on recent processors. Internally it uses the RDTSC instruction. Since the counter is processor specific you can get greatly different values when your thread is scheduled to another core or the core goes into a power saving mode. But things do change luckily:

Intel's Designer's vol3b, section 16.11.1

"16.11.1 Invariant TSC

The time stamp counter in newer processors may support an enhancement, referred to as invariant TSC. Processor's support for invariant TSC is indicated by CPUID.80000007H:EDX[8].

The invariant TSC will run at a constant rate in all ACPI P-, C-. and T-states. This is the architectural behavior moving forward. On processors with invariant TSC support, the OS may use the TSC for wall clock timer services (instead of ACPI or HPET timers). TSC reads are much more efficient and do not incur the overhead associated with a ring transition or access to a platform resource."

DateTime.NowGood but it has only a resolution of 16ms which can be not enough if you want more accuracy.


Reporting MethodPotential Pitfalls
Console.WriteLineOk if not called too often.
Debug.PrintAre you really measuring performance with Debug Builds? Shame on you.
Trace.WriteLineBetter but you need to plug in some good output listener like a trace file. But be aware that the first time you call this method it will read your app.config and deserialize your system.diagnostics section which does also take time.


In general it is a good idea to use some tracing library which does measure the timing for you and you only need to decorate some methods with tracing so you can later verify if something has changed for the better or worse. In my previous article I did compare measuring performance with quantum mechanics. This analogy does work surprising well. When you measure a quantum system there is a lower limit how accurately you can measure something. The Heisenberg uncertainty relation does tell us that you cannot measure of a quantum system the impulse and location of a particle at the same time with infinite accuracy. For programmers the two variables are execution time and memory allocations.

If you try to measure the timings of all methods in your application you will need to store them somewhere. The fastest storage space besides the CPU cache is the memory. But if your timing values do consume all available memory there is no memory left for the actual application to run.

On the other hand if you try to record all memory allocations of your application you will also need to store the data somewhere. This will cost you memory and execution time.

These constraints are always there and regardless how good the marketing of tool vendors for performance and memory profilers are:

Any measurement will disturb the system in a non predictable way.

Commercial tool vendors will tell you they do calculate this overhead and subtract it from the measured values to give you the most accurate values but in reality it is not entirely true. After falling into the trap to trust the profiler timings several times I have got into the habit to

  1. Measure with a profiler to get an idea where potential bottlenecks are.
  2. Measure again with tracing only the specific methods to check if this method is really worth optimizing.
  3. Optimize it
  4. Measure again.
  5. Be surprised that your optimization has made things worse.
  6. Think harder
  7. Implement something that really works.
  8. Measure again
  9. Finished! - Or look for the next bottleneck.

Recently I have looked into issues with serialization performance. For serialization DataContractSerializer was used and I was not sure if XML is really the most optimal wire format. After looking around I have found protobuf-net which uses Googles Protocol Buffer format which is a compact binary serialization format. What is good for Google should be good for us.

A small sample app to check out performance was a matter of minutes:

using ProtoBuf;using System;using System.Diagnostics;using System.IO;using System.Reflection;using System.Runtime.Serialization;

[DataContract, Serializable]
class Data
{
    [DataMember(Order=1)]publicint IntValue { get; set; }

    [DataMember(Order = 2)]
    publicstring StringValue { get; set; }

    [DataMember(Order = 3)]
    publicbool IsActivated { get; set; }

    [DataMember(Order = 4)]
    public BindingFlags Flags { get; set; }
}class Program
{static MemoryStream _Stream = new MemoryStream();static MemoryStream Stream 
    {
        get 
        {
            _Stream.Position = 0;
            _Stream.SetLength(0);return _Stream;
        }
    }staticvoid Main(string[] args)
    {
        DataContractSerializer ser = new DataContractSerializer(typeof(Data));
        Data data = new Data 
        { 
            IntValue = 100, 
            IsActivated = true, 
            StringValue = "Hi this is a small string value to check if serialization does work as expected"
        };

        var sw = Stopwatch.StartNew();
        int Runs = 1000 * 1000;for (int i = 0; i < Runs; i++)
        {//ser.WriteObject(Stream, data);
            Serializer.Serialize<Data>(Stream, data);
        }
        sw.Stop();
        Console.WriteLine("Did take {0:N0}ms for {1:N0} objects", sw.Elapsed.TotalMilliseconds, Runs);
        Console.ReadLine();
    }
}

The results are indeed promising:
SerializerTime in msN objects
protobuf-net  8071000000
DataContract44021000000

Nearly a factor 5 faster and a much more compact wire format. Lets use it! After switching over to protbuf-net the transfered wire data has dropped by a factor two (good) and the performance has worsened by nearly a factor two. How is that possible? We have measured it? Protobuf-net is much faster! As it turns out protobuf-net is faster but it has a cost: For the first time a type is de/serialized it does use some very smart code-gen which does not come for free. Lets try to measure this one by setting of our performance test app the Runs value not to one million but to 1.

SerializerTime in msN objects
protobuf-net851
DataContract241

The code-gen overhead is significant and can take up to 200ms for more complex types. The break even point where the code-gen cost is amortized by its faster serialization performance is (assuming small objects) somewhere between 20.000-40.000 serialized objects. As it turned out my specific scenario involved about 100 types and 1000 serializations in total. That explains why the good old DataContractSerializer is not so easy to take out of business. The final approach I ended up was to reduce the number of types and to serialize primitive types via BinaryWriter directly which turned out to be a pretty good alternative.

It sounded good until I measured again and found that my optimizations so far do not help much. After looking more deeper at the profiling data I did found that one of the 1000 calls did take 50% of the time. So how do I find out which call it was? Normal profilers do fail short at this discipline. A (totally undeserved) relatively unknown profiler is SpeedTrace which does unlike normal profilers create traces of your applications by instrumenting your IL code at runtime. This way you can look at the full call stack of the one slow serializer call to find out if this stack was something special.

Unfortunately the call stack showed nothing special. But luckily I have my own tracing as well and I could see that the slow serializer call did happen during the serialization of a bool value. When you encounter after much analysis something unreasonable you cannot explain it then the chances are good that your thread was suspended by the garbage collector. If there is a problem with excessive GCs remains to be investigated but so far the serialization performance seems to be mostly ok. 

When you do profile a complex system with many interconnected processes you can never be sure that the timings you just did measure are accurate at all. Some process might be hitting the disc slowing things down for all other processes for some seconds as well. There is a big difference between warm and cold startup. If you restart all processes you can basically forget the first run because of the OS disc cache, JIT and GCs make the measured timings very flexible. When you are in need of a random number generator you should measure cold startup times of a sufficiently complex system. After the first run you can try again getting different and much lower numbers. Now try again at least two times to get some feeling how stable the numbers are.

Oh and try to do the same thing the next day. It might be that the bottleneck you found yesterday is gone today. Thanks to GC and other random stuff it can become pretty hard to find stuff worth optimizing if no big bottlenecks except bloatloads of code are left anymore.

When I have found a spot worth optimizing I do make the code changes and do measure again to check if something has changed. If it has got slower and I am certain that my change should have made it faster I can blame the GC again. The thing is that if you optimize stuff and you allocate less objects the GC times will shift to some other location. If you are unlucky it will make your faster working code slower because you see now GCs at times where none were before. This is where the stuff does get really tricky. A safe escape hatch is to create a repro of the slow code in an isolated application so you can change things fast in a reliable manner. Then the normal profilers do also start working again.

As Vance Morrison does point out it is much more complex to profile a system against the wall clock compared to optimize for CPU time. The reason is that for wall clock time analysis you need to understand how your system does work and which threads (if you have not one but perhaps 20) are causing a visible delay to the end user and which threads can wait a long time without affecting the user experience at all.

Next time: Commercial profiler shootout.

Profiling Startup Of VS2012 – Ants Profiler

$
0
0

Originally posted on: http://geekswithblogs.net/akraus1/archive/2012/11/30/151409.aspx

I just downloaded ANTS Profiler 7.4 to check how fast it is and how deep I can analyze the startup of Visual Studio 2012. The Pro version which is useful does cost 445€ which is ok. To measure a complex system I decided to simply profile VS2012 (Update 1) on my older Intel 6600 2,4GHz with 3 GB RAM and a 32 bit Windows 7. Ants Profiler is really easy to use. So lets try it out.

The Ants Profiler does want to start the profiled application by its own which seems to be rather common. I did choose Method Level timing of all managed methods. In the configuration menu I did want to get all call stacks to get full details. Once this is configured you are ready to go.

image


image

After that you can select the Method Grid to view Wall Clock Time in ms. I hate percentages which are on by default because I do want to look where absolute time is spent and not something else.


image

From the Method Grid I can drill down to see where time is spent in a nice and I can look at the decompiled methods where the time is spent.

image

This does really look nice. But did you see the size of the scroll bar in the method grid? Although I wanted all call stacks I do get only about 4 pages of methods to drill down. From the scroll bar count I would guess that the profiler does show me about 150 methods for the complete VS startup.

Update: I did miss to uncheck the checkbox Hide Insignificant methods. Sorry about that one. After that I do get a reasonable method list. Yes I am aware that I can attach to a process later but then I do get only sampled call stacks and not full details like

with tracing which is much better.

image

This is nonsense. I will never find a bottleneck in VS when I am presented only a fraction of the methods that were actually executed. I have also tried in the configuration window to also profile the extremely trivial functions but there was no noticeable difference. It seems that the Ants Profiler does filter away way too many details to be useful for bigger systems. If you want to optimize a CPU bound operation inside NUnit then Ants Profiler is with its line level timings a very nice tool to work with. But for bigger stuff it is certainly not usable. I also do not like that I must start the profiled application from the profiler UI. This makes it hard to profile processes which are started by some other process.

Next: JetBrains dotTrace

Profiling Startup Of VS2012 – dotTrace Profiler

$
0
0

Originally posted on: http://geekswithblogs.net/akraus1/archive/2012/12/01/151413.aspx

Jetbrains which is famous for the Resharper tool has also a profiler in its portfolio. I downloaded dotTrace 5.2 Professional (569€+VAT) to check how far I can profile the startup of VS2012. The most interesting startup option is “.NET Process”. With that you can profile the next started .NET process which is very useful if you want to profile an application which is not started by you.

image image


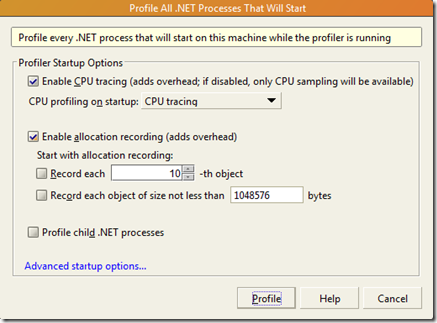
I did select Tracing as and Wall time to get similar options across all profilers. For some reason the attach option did not work with .NET 4.5 on my home machine. But I am sure that it did work with .NET 4.0 some time ago. Since we are profiling devenv.exe we can also select “Standalone Application” and start it from the profiler. The startup time of VS does increase about a factor 3 but that is ok. You get mainly three windows to work with. The first one shows the threads where you can drill down thread wise where most time is spent.

I image

The next window is the call tree which does merge all threads together in a similar view.

image

The last and most useful view in my opinion is the Plain List window which is nearly the same as the Method Grid in Ants Profiler. But this time we do get when I enable the Show system functions checkbox not a 150 but 19407 methods to choose from! I really tried with Ants Profiler to find something about out how VS does work but look how much we were missing!

When I double click on a method I do get in the lower pane the called methods and their respective timings. This is something really useful and I can nicely drill down to the most important stuff. The measured time seems to be Wall Clock time which is a good thing to see where my time is really spent. You can also use Sampling as profiling method but this does give you much less information. Except for getting a first idea where to look first this profiling mode is not very useful to understand how you system does interact.


image

The options have a good list of presets to hide by default many method and gray them out to concentrate on your code. It does not filter anything out if you enable Show system functions. By default methods from these assemblies are hidden or if the checkbox is checked grayed out.

image

All in all JetBrains has made a nice profiler which does show great detail and it has nice drill down capabilities. The only thing is that I do not trust its measured timings. I did fall several times into the trap with this one to optimize at places which were already fast but the profiler did show high times in these methods. After measuring with Tracing I was certain that the measured times were greatly exaggerated. Especially when IO is involved it seems to have a hard time to subtract its own overhead. What I did miss most was the possibility to profile not only the next started process but to be able to select a process by name and perhaps a count to profile the next n processes of this name.

Next: YourKit


Profiling Startup Of VS2012 – YourKit Profiler

$
0
0

Originally posted on: http://geekswithblogs.net/akraus1/archive/2012/12/02/151429.aspx


The YourKit (v7.0.5) profiler is interesting in terms of price (79€ single place license, 409€ + 1 year support and upgrades) and feature set. You do get a performance and memory profiler in one package for which you normally need also to pay extra from the other vendors. As an interesting side note the profiler UI is written in Java because they do also sell Java profilers with the same feature set. To get all methods of a VS startup you need first to configure it to include System* in the profiled methods and you need to configure * to measure wall clock time. By default it does record only CPU times which allows you to optimize CPU hungry operations. But you will never see a Thread.Sleep(10000) in the profiler blocking the UI in this mode.

imageimage

It can profile as all others processes started from within the profiler but it can also profile the next or all started processes.

imageimage

As usual it can profile in sampling and tracing mode. But since it is a memory profiler as well it does by default also record all object allocations > 1MB. With allocation recording enabled VS2012 did crash but without allocation recording there were no problems. The CPU tab contains the time line of the application and when you click in the graph you the call stacks of all threads at this time. This is really a nice feature. When you select a time region you the CPU Usage estimation for this time window.

image

I have seen many applications consuming 100% CPU only because they did create garbage like crazy. For this is the Garbage Collection tab interesting in conjunction with a time range.

image

This view is like the CPU table only that the CPU graph (green) is missing. All relevant information except for GCs/s is already visible in the CPU tab. Very handy to pinpoint excessive GC or CPU bound issues.

The Threads tab does show the thread names and their lifetime. This is useful to see thread interactions or which thread is hottest in terms of CPU consumption.

image

On the CPU tab the call tree does exist in a merged and thread specific view. When you click on a method you get below a list of all called methods. There you can sort for methods with a high own time which are worth optimizing.

image

In the Method List you can select which scope you want to see. Back Traces are the methods which did call you.

image

Callees ist the list of methods called directly or indirectly by your method as a flat list. This is not a call stack but still very useful to see which methods were slow so you can see the “root” cause quite quickly without the need to click trough long call stacks.

image

The last view Merged Calles is a call stacked view of the previous view. This does help a lot to understand did call each method at run time. You would get the same view with a debugger for one call invocation but here you get the full statistics (invocation count) as well.

image

Since YourKit is also a memory profiler you can directly see which objects you have on your managed heap and which objects do hold most of your precious memory. You can in in the Object Explorer view also examine the contents of your objects (strings or whatsoever) to get a better understanding which objects where potentially allocating this stuff.


image

YourKit is a very easy to use combined memory and performance profiler in one product. The unbeatable single license price makes it very attractive to straightly buy it. Although it is a Java UI it is very responsive and the memory consumption is considerably lower compared to dotTrace and ANTS profiler. What I do really like is to start the YourKit ui and then start the processes I want to profile as usual. There is no need to alter your own application code to be able to inject a profiler into your new started processes. For performance and memory profiling you can simply select the process you want to investigate from the list of started processes.

image

That's the way I like to use profilers. Just get out of the way and let the application run without any special preparations.


Next: Telerik JustTrace

Profiling Startup Of VS2012 – JustTrace Profiler

$
0
0

Originally posted on: http://geekswithblogs.net/akraus1/archive/2012/12/02/151430.aspx

JustTrace is made by Telerik which is mainly known for its collection of UI controls. The current version (2012.3.1127.0) does include a performance and memory profiler which does cost 614€ and is currently with a special offer for 306€ on sale. It does include one year of free upgrades. The uneven € numbers are calculated from the 799€ and 399$ discount price. The UI is already in Metro style and simple to use. Multi process,

attach, Update (attach is supported when you select as Profilee type “Running Application” in sampling mode) method recording filter are not supported.

imageimage

It looks like JustTrace is like Ants a Just My Code profiler by default.

At least I have not (yet) found an option to see all methods. Update:There is a button there as well. I did not press it since it did look disabled to me. I guess I just too old to spot the difference between disabled and not enabled. You need to press the Minor Methods button to see all methods. Now I do see much more but unfortunately I still cannot sort by total time which is strange for a profiler. In the All Threads window there is a Total Time column but I do not get it why I do not have it in the All Methods view. For stuff where you do not have the pdbs or you want to dig deeper into the BCL code you will not get far. After getting the profile data you get in the All Methods grid a plain list with hit count and own time. The method list for all methods is also suspiciously short which is a clear sign that you will not get far during the analysis of foreign code. It looks like this is intentional because I cannot configure the displayed columns where I get at least the total time as well.

image

But at least there is also a memory profiler included. For this I have to choose in the first window for Profiling Type “Memory Profiler” to check the memory consumption of VS.  There are some interesting number to see but I do really miss from YourKit the thread stack window. How am I supposed to get a clue when much memory is allocated and the CPU consumption is high in which places I should look?

clip_image001

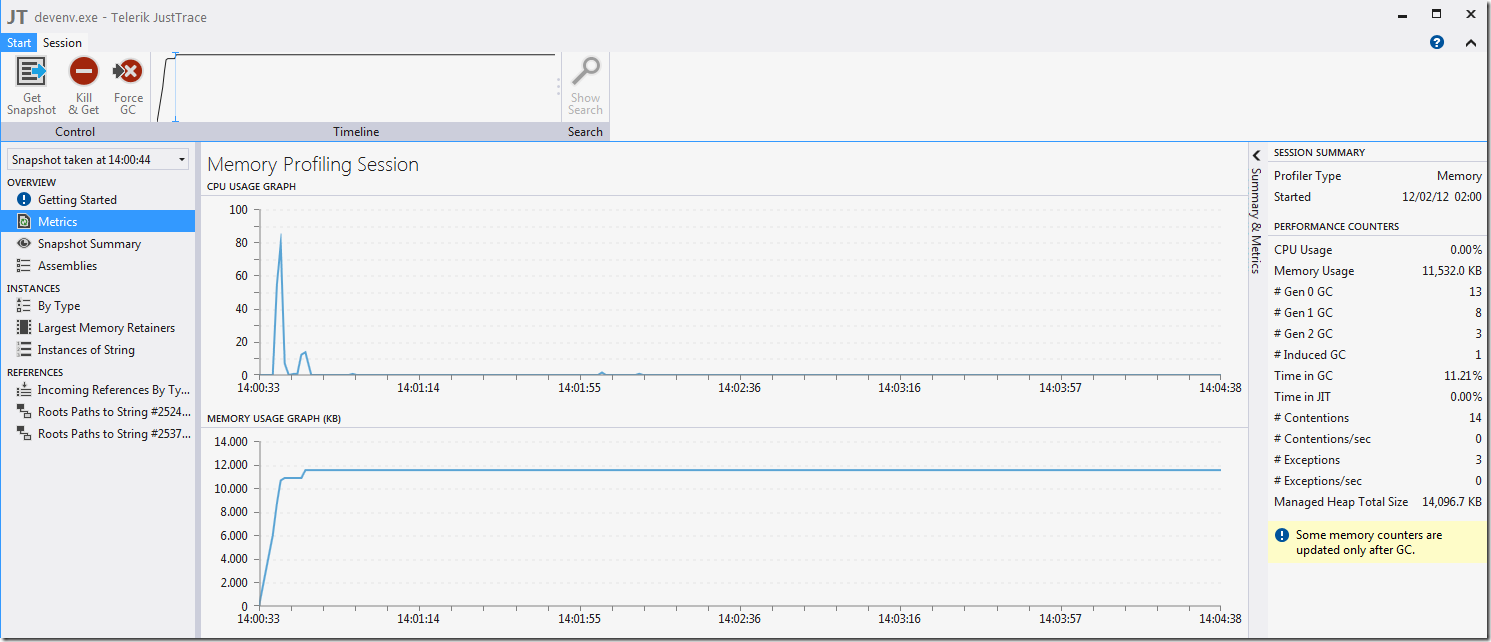
The Snapshot summary gives a rough overview which is ok for a first impression.

image

Next is Assemblies? This gives you a list of all loaded assemblies. Not terribly useful.


image

The By Type view gives you exactly what it is supposed to do. You have to keep in mind that this list is filtered by the types you did check in the Assemblies list.

image

The By Type instance list does only show types from assemblies which do not originate from Microsoft. By default mscorlib and System are not checked. That is the reason why for the first time my By Type window looked like

image

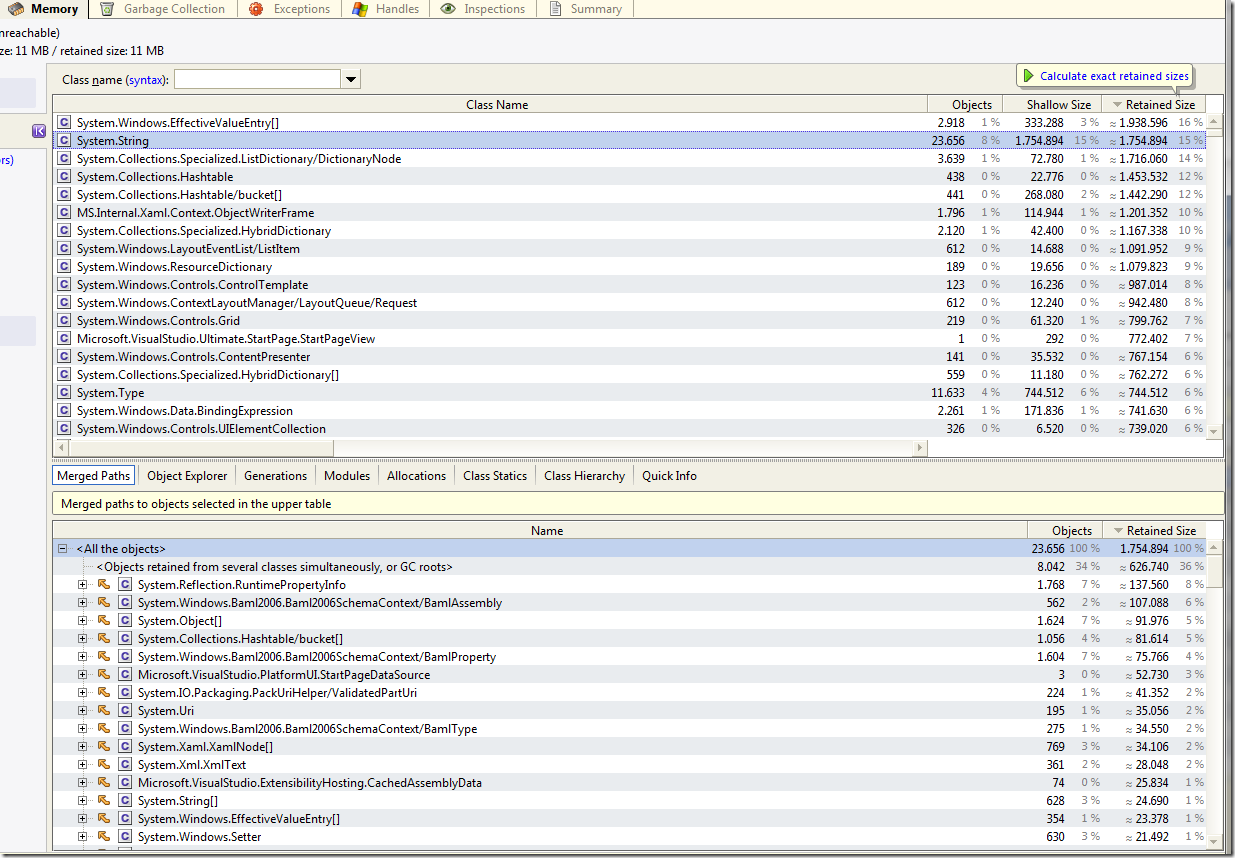
The idea behind this feature is to show only your instances because you are ultimately responsible for the overall memory consumption. I am not sure if I do like this feature because by default it does hide too much. I do want to see at least how many strings and arrays are allocated. A simple namespace filter would also do it in my opinion. Now you can examine all string instances and look who in the object graph does keep a reference on them.

imageimage

That is nice but YourKit has the big plus that you can also look into the string contents.  I am also not sure how in the graph cycles are visualized and what will happen if you have thousands of objects referencing you. That's pretty much it about JustTrace. It can help the average developer to pinpoint performance and memory issues by just looking at his own code and instances. Showing them more will not help them because the sheer amount of information will overwhelm them. And you need to have a pretty good understanding how the GC and the CLR does work. When you have a performance issue at a customer machine it is sometimes very helpful to be able a bring a profiler onto the machine (no pdbs, …) and to get a full snapshot of all processes which are in the problematic use case involved. For these more advanced use cased JustTrace is certainly the wrong tool.

Next: SpeedTrace

Profiling Startup Of VS2012 – SpeedTrace Profiler

$
0
0

Originally posted on: http://geekswithblogs.net/akraus1/archive/2012/12/02/151431.aspx

SpeedTrace is a relatively unknown profiler made a company called Ipcas. A single professional license does cost 449€+VAT. For the test I did use SpeedTrace 4.5 which is currently Beta. Although it is cheaper than dotTrace it has by far the most options to influence how profiling does work.

First you need to create a tracing project which does configure tracing for one process type. You can start the application directly from the profiler or (much more interesting) it does attach to a specific process when it is started. For this you need to check “Trace the specified …” radio button and enter the process name in the “Process Name of the Trace” edit box. You can even selectively enable tracing for processes with a specific command line. Then you need to activate the trace project by pressing the Activate Project button and you are ready to start VS as usual. If you want to profile the next 10 VS instances that you start you can set the Number of Processes counter to e.g. 10. This is immensely helpful if you are trying to profile only the next 5 started processes.

image

As you can see there are many more tabs which do allow to influence tracing in a much more sophisticated way. SpeedTrace is

the only a profiler which does not rely entirely on the profiling Api of .NET. Instead it does modify the IL code (instrumentation on the fly) to write tracing information to disc which can later be analyzed. This approach is not only very fast but it does give you unprecedented analysis capabilities. Once the traces are collected they do show up in your workspace where you can open the trace viewer.

image

I do skip the other windows because this view is the most useful one. You can sort the methods not only by Wall Clock time but also by CPU consumption and wait time which none of the other products support in their views at the same time. If you want to optimize for CPU consumption sort by CPU time. If you want to find out where most time is spent you need Clock Total time and Clock Waiting. There you can directly see if the method did take long because it did wait on something or it did really execute stuff that did take so long.

Once you have found a method you want to drill deeper you can double click on a method to get to the Caller/Callee view which is similar to the JetBrains Method Grid view. But this time you do see much more. In the middle is the clicked method. Above are the methods that call you and below are the methods that you do directly call. Normally you would then start digging deeper to find the end of the chain where the slow method worth optimizing is located. But there is a shortcut.

You can press the magic image  button to calculate the aggregation of all called methods. This is displayed in the lower left window where you can see each method call and how long it did take. There you can also sort to see if this call stack does only contain methods (e.g. WCF connect calls which you cannot make faster) not worth optimizing. YourKit has a similar feature where it is called Callees List.

image

In the Functions tab you have in the context menu also many other useful analysis options

image

One really outstanding feature is the View Call History Drilldown. When you select this one you get not a sum of all method invocations but a list with the duration of each method call. This is not surprising since SpeedTrace does use tracing to get its timings. There you can get many useful graphs how this method did behave over time. Did it become slower at some point in time or was only the first call slow? The diagrams and the list will tell you that.

imageimage

image

That is all fine but what should I do when one method call was slow? I want to see from where it was coming from. No problem select the method in the list hit F10 and you get the call stack. This is a life saver if you e.g. search for serialization problems. Today Serializers are used everywhere. You want to find out from where the 5s XmlSerializer.Deserialize call did come from? Hit F10 and you get the call stack which did invoke the 5s Deserialize call. The CPU timeline tab is also useful to find out where long pauses or excessive CPU consumption did happen. Click in the graph to get the Thread Stacks window where you can get a quick overview what all threads were doing at this time. This does look like the Stack Traces feature in YourKit. Only this time you get the last called method first which helps to quickly see what all threads were executing at this moment. YourKit does generate a rather long list which can be hard to go through when you have many threads.

image

The thread list in the middle does not give you call stacks or anything like that but you see which methods were found most often executing code by the profiler which is a good indication for methods consuming most CPU time.

This does sound too good to be true? I have not told you the best part yet. The best thing about this profiler is the staff behind it. When I do see a crash or some other odd behavior I send a mail to Ipcas and I do get usually the next day a mail that the problem has been fixed and a download link to the new version. The guys at Ipcas are even so helpful to log in to your machine via a Citrix Client to help you to get started profiling your actual application you want to profile. After a 2h telco I was converted from a hater to a believer of this tool. The fast response time might also have something to do with the fact that they are actively working on 4.5 to get out of the door. But still the support is by far the best I have encountered so far.

The only downside is that you should instrument your assemblies including the .NET Framework to get most accurate numbers. You can profile without doing it but then you will see very high JIT times in your process which can severely affect the correctness of the measured timings. If you do not care about exact numbers you can also enable in the main UI in the Data Trace tab logging of method arguments of primitive types. If you need to know what files at which times were opened by your application you can find it out without a debugger.

Since SpeedTrace does read huge trace files in its reader you should perhaps use a 64 bit machine to be able to analyze bigger traces as well. The memory consumption of the trace reader is too high for my taste. But they did promise for the next version to come up with something much improved.

Profiling Code – The Microsoft Way

$
0
0

Originally posted on: http://geekswithblogs.net/akraus1/archive/2012/12/19/151604.aspx

A colleague of mine asked me how he can find out why his laptop does consume 30% CPU in the SYSTEM process after it did wake up from hibernate. That is easy I replied: Open Process Explorer select the SYSTEM process, double click it, select the thread tab, sort by CPU and double click on the first thread which does consume so much CPU to get the call stack.

A few days later I got a mail back that it did not work. Ok could be some elevation problem. I did try it on my machine and sure enough access denied also here. Ups it is not so easy after all. A little googling around did lead to a very good article from Mark Russinovich dealing with the exact same issue. Mark did use Kernrate which seems to work still on Windows 7 but it does look rather unsupported. A few other articles indicated that xperf should also be able to do it. So I did look where to get the latest edition of XPerf. It turns out that it is part of the Windows 8 SDK and the Windows Assessment and Deployment Kit (ADK) für Windows® 8. You do not need to download GBs of stuff. Only select the Windows Performance Toolkit and uncheck all other stuff. That gives you a nice ~50MB download which will install it to

%PROGRAMFILES(X86)%\Windows Kits\8.0\Windows Performance Toolkit

Besides the well known Xperf tool I have written several years ago some new stuff was added. Recording performance with the latest version of the Windows Performance Toolkit has never been so easy. There is a tool called WPRUI.exe which allows you to record a trace session with a nice GUI. An interesting side note is that this tool is missing in the Windows 8 SDK delivered with Visual Studio 2012. If you download the latest version again you get the GUI tool as well. It does seem to have full support from MS and they did even localize the UI which is rather unusual for such low level tools.

image

When you select CPU, Disc and File IO you should be able to troubleshoot pretty much anything. The UI is easy to use and is even so nice to set some arcane registry key if you are using Windows 7 x64 to enable full stack walks in kernel drivers which seems to be broken otherwise. After you have saved the trace etl file you should cancel recording or you will be recording GB of additional data.

Now you are ready to load the trace file into the viewer which is called wpa.exe. After a little rearranging the stuff you get a pretty good picture what VS is doing during the first startup which is called cold startup because no files are in the OS file system cache yet. That means much more disc accesses during the first startup compared to a second warm startup of VS. How much more? We will shortly see. Here comes the picture:

image

Holy crap. What is all this? Well I have cut out most columns. This is already a simplified view ;-). On the left side you can select from the Graph Explorer many diagram types via drag and drop or context menu and add it to the Analysis pane. First I want to see what my CPU was doing by selecting “CPU Usage (precise) Utilization by Process Thread”. Next I do filter only for devenv.exe in each graph. But wait: Did you say filter for process? Yes this tool gives you view of the complete system with all processes at once. It goes so far that you can even watch the OS scheduler doing its work. The call stacks with the official MS symbols can be resolved into the kernel and to all user mode processes. Lets say you call in one thread BeginInvoke and wait for some other event you can see in the CPU graph with the columns Old/New Thread Stacks to which other thread/process the OS scheduler has moved control.

Besides CPU consumption disc IO is the most important metric to closely have a look at. For this I did select the graph “Utilization by Process, IO Type” to see at which times the disc is maxed out. I can see the file names which were access and I can see how much time the OS did spend with the hard disc reading this file. The most important column there is Disc Service Time which gives you the timing at ns granularity. Here we do e.g. see that during the cold startup we did spend 0,355s loading the file System.Xml.ni.dll. When you click at the file you see in the graph at which points of time it was read. The bigger blue bars indicate the first and last read event. In the CPU Graph I did also get a lot of selected rows. Why is this? First I thought it was an error but it was of course a feature.

Since we have a complete view of the system at our hands the tooling is able to follow all call stacks. This means that when I select the accessed file the tool does select all processes and threads that were blocked during one of the accesses to this file! Now I can find out why my mouse cursor does jump when I do start a very disc intensive application. Some years ago this stuff was unmanaged land only. But the latest version of it is also able to fully traverse managed call stacks now as you can see in the above call stack of the CPU graph. There you do see also a blue selected method called GetProfile which will obviously later lead to a blocking call in the call stack when trying to deserialize its data with XmlSerializer leading to reads to System.Xml.ni.dll.

The managed call stacks for native images are retrieved by a matching pdb for each native image. When you do google for “ngen create pdb” you will find more info about this feature. It does look like a Windows 8 and .NET 4.5 feature but it is not. This does work on Windows 7 with .NET 4.0 perfectly well. The first trace collection will take a quite long time because for each native image is ngen createpdb called to store a synthetic pdb  at C:\ProgramData\WindowsPerformanceRecorder. This little thingy allows it to fully walk managed and unmanaged call stacks. But what about assemblies that are not NGened?

Good question. The short and good answer is: It does work. Below is a screen shot of a normal application I did create to read from the event log. You do see the Main method, the wrapped delegate call…. All is there. There is some stuff in the NGen images stored which is needed because I do get no such stack when I did not load the unmanaged and synthetic Ngen symbols before.

image

My symbol path does therefore look like this:

image

It does not include the MS symbol server because I have the most important symbols stored at C:\Windows\symbols already. This makes symbol loading a matter of seconds and not many minutes. PerfMonitor was a tool that was enabled mixed mode stack walking with ETW events first. You can read more at Naveens blog. For the NGen pdb support there seems to be pretty much magic involved which includes some CLR Rundown ETW traces you can read more about at the official docs which makes this look like a Windows 8 feature again. Anyway. It does work on Windows 7 perfectly well and I do not care about the exact details.

Now we can start VS 2012 a second time and compare CPU and disc utilization.

image

The second startup is much faster. It is only about 3s compared to 6s the first time. The warm vs cold startup performance is a mystery you cannot solve with most profilers which are commercially available. Now you can see all with a free tool. The disc utilization is practically zero this time. We do spend only 13ms compared to 2163ms during the second startup in accessing the disc. All other data comes from the OS cache which boils down to a memcpy when the application does call ReadFile. As you can see this view gives you not a API level view of the disc where we do read from “disc” when we call CreateFile and ReadFile to open and read from it. This gives you direct insights when the hard disc is shuffling data around.

This tool has the potential to supersede many other profilers because you get a holistic view of the complete system with full managed call stack support now.

There is much more to say about this fantastic tool. But I need some sleep now.

How To Make Your System Slower With WMI

$
0
0

Originally posted on: http://geekswithblogs.net/akraus1/archive/2012/12/28/151662.aspx

With the new Windows Performance Toolkit you can now identify bottlenecks in your system which did not show up in any profiler. Lets e.g. query for some system properties via WMI.

staticvoid Main(string[] args)
    {
        var sw = Stopwatch.StartNew();string[] queries = newstring[] { "Win32_Processor", "Win32_Printer", "Win32_ComputerSystem", "Win32_VideoController", "Win32_PhysicalMemory", "Win32_LogicalDisk" };foreach(var wmiColl in queries.Select(x=> new ManagementObjectSearcher(new SelectQuery(x)))
                                      .Select(query => query.Get()))
        {foreach(var prop in wmiColl.Cast<ManagementBaseObject>()
                                       .SelectMany(x=>x.Properties.Cast<PropertyData>()))
            {//Console.WriteLine("{0} - {1}", prop.Name, prop.Value);
            }
        }
        sw.Stop();
        Console.WriteLine("Time: {0:F1}s", sw.Elapsed.TotalSeconds);
    }

This takes around 1,6s on my machine. When I do look at my process (ConsoleApplication1.exe) the CPU consumption is rather low.


image

So where is the time spent? It could be some disc IO happening during the queries. The check for disc IO we need the Disc Usage “Utilization by Process, IO Type” graph. As you can see for the specified time there was no disc IO at all happening. A flat line does not mean that there were no CreateFile/ReadFile calls at all. But if you call ReadFile on a file which contents are already cached by the OS reading from a file is only a matter of a CopyMemory call. This graph will show you only real disc accesses.

image

In the CPU graph you can see that the ConsoleApplication1.exe was not the process with most CPU consumption. Most CPU cycles were spent in WmiPrvSE, spoolsv and svchost. So lets graph them as well. You can enable or disable items in the graph by left clicking on the color box or via the context menu. In the context menu you have Enable … or Disable … menus to enable or disable all or only the selected processes/threads, …

image

We see that although our process did only consume 2,8% of CPU for all WMI queries we did max out one core with a WMI worker process (50% is one core for a dual core machine. If you have an 8 core machine one core would be 12,5%). In total we did consume 45% CPU time which means one core was fully utilized to process the WMI queries! At least this is the working hypothesis that our WMI queries did cause the load in the other processes. How can we verify this? First we can have a look at the call stacks in our process.

image

Here we do see nicely the full managed call stacks. At least with .NET 4.5. If you have .NET 4.0 you will only see only the first managed stack frame and then nothing.It is better than nothing but it should be improved for .NET 4.0 as well.

Update:

To get full managed stacks it does work with .NET 4.0 as well for x86 processes. It does only fail when you want to profile 64 bit processes under Windows Vista or Windows 7. There is a bug in the stalk walking algorithm which does stop when it does encounter the first dynamically generated stack frame which address is not inside a loaded module. To workaround this issue you can NGen your assemblies to get full call stacks as well. This is a bit cumbersome to work with but it does work very nicely. The only issue is that truly dynamic code like WCF proxies and stuff like this will not work out as expected.

The other fix to this issue is to use Windows 8.

The ManagementObjectCollection does some COM calls to communicate with the WMI service where we do wait for a response from a COM object. When our thread gives up its time slice by calling some wait method the OS does schedule the next thread in the ready queue. This topic is covered in greater detail here which is part of the WPT docu. Here is a copy of the relevant part:


Each thread exists in a particular execution state at any given time. Windows uses three states that are relevant to performance; these are: Running, Ready, and Waiting.

Threads that are currently being executed are in the Running state. Threads that can execute but are currently not running are in the Ready state. Threads that cannot run because they are waiting for a particular event are in the Waiting state.

A state to state transition is shown in Figure 1 Thread State Transitions:

Figure 1 Thread State Transition

Figure 1 Thread State Transitions

Figure 1 Thread State Transitions is explained as follows:

  1. A thread in the Running state initiates a transition to the Waiting state by calling a wait function such as WaitForSingleObject or Sleep(> 0).
  2. A running thread or kernel operation readies a thread in the Waiting state (for example, SetEvent or timer expiration). If a processor is idle or if the readied thread has a higher priority than a currently running thread, the readied thread can switch directly to the Running state. Otherwise, it is put into the Ready state.
  3. A thread in the Ready state is scheduled for processing by the dispatcher when a running thread waits, yields (Sleep(0)), or reaches the end of its quantum.
  4. A thread in the Running state is switched out and placed into the Ready state by the dispatcher when it is preempted by a higher priority thread, yields (Sleep(0)), or when its quantum ends.

A thread that exists in the Waiting state does not necessarily indicate a performance problem. Most threads spend significant time in the Waiting state, which allows processors to enter idle states and save energy. Thread state becomes an important factor in performance only when a user is waiting for a thread to complete an operation.


This means that we can see where our thread was rescheduled by the OS to execute the next non waiting thread. To see the next executing thread you need to right click on the column header of the list and add ReadyThreadStack. This allows you to follow the trail of your thread from one process to the next process. It is not a 100% correlation but the chances are good that the next ready thread is the one that the OS has scheduled as next thread to execute now. Since the the WPT toolkit does record the call stacks after every context switch we can get a deep understanding how the threads do interact with each other. When we do follow now the ReadThreadStack until it does give up control by itself we do see that we did end up in svhost (1028). It would be interesting to see which system services were running inside it to confirm that our process has something to do with it.

image

Unfortunately there is no column command line or running services available in this view. But there is a view called Processes “Lifetime By Process” which does give us the command line of all processes and the hosted services if any. This way we do see that our call did end up in the service which does host the WMI (Winmgmt) service which sounds reasonable.

image

When we do look into the call stacks of our WMI service host process we do find in the ReadyThreadStack many times our console application which is not surprising since it does need to send the results back to our process. There are only a few calls to WmiPrvSE.exe (1516) which do execute the WMI queries in some WMI worker process where the actual WMI provider objects are living. When we do inspect the WMI worker process more closely we will find that it does some work with svchost(700) which is responsible for DCOM calls. No we have a pretty good understanding what is actually going on.

  1. ConsoleApplication1 does issue some WMI query calls.
  2. These calls are processed by the WMI service (svchost 1028) which does hand these calls to a WMI worker process
  3. WmiPrvSE.exe (1516) does execute the actual queries.
  4. The execution of the “Win32_Printer” query does cause some heavy load in the print spooling service (spoolsv 1648).
  5. Some WMI call (the fetching of display device infos) requires the activation of some remote COM object which causes some load in the DCOM system service (svchost 700).

From this we can conclude that our process did cause with a 2,8% CPU load in our process a total load of nearly 50% (that means one core was full utilized). The load in our process did cause a 15 times higher load in other processes in the system!

I do really love this tool since it allows you to analyze cross process correlations which no other profiler can do I have encountered so far. It seems that the initial target audience of this tool were kernel developers but over the years XPerf has now reached the state of a full system wide profiler for managed and unmanaged applications. The managed part does work best with .NET 4.5 but you can get useful insights with .NET 4.0 already. Now we have found hat the WMI calls in our process were rather cheap but the whole system was under quite high load due to the WMI queries. Be careful to not overuse WMI since it might hurt overall system performance for no good reasons.

There is good content in the WPT toolkit online to guide you to more CPU scenarios. I found the thread starvation analysis especially interesting. If you see in your thread high Ready (us) times then you have a problem because this means that your thread was sitting too long in the Thread Ready queue to be scheduled for execution. Now you can not only see that your thread was treated unfair by the OS but you can also find out which other thread did get in your way (could be another process, higher thread priority …).

I am still shocked to see how many professional developers do not use profiling tools at all. I am not sure how they tackle tricky performance or memory issues. But I do think the answer is: They do not do it. If performance problems are tackled by “normal” devs only on demand by management because customers did complain about crappy performance they will only be able to iron out the big performance bottlenecks. The medium and small ones will be left as an exercise for the next dev. There may still be big issues in the product but they will not be able to analyze it down to the root cause. Part of the issue was that there was no good tool available to analyze managed and unmanaged code at the same time.

The tool problem is gone now.

There is no longer an excuse to say: I do not know how to dig deeper.

But there is another excuse left: I do not know how to read kernel stacks…

Now you can dig from your process and thread into the kernel and back to another process in another thread with a few clicks. Yes this tool is complex but this is our software we do write today as well. And there are times where all these nice abstractions of a managed execution environment, automated garbage collection, dynamic code generation, kernel mode transitions, OS thread scheduling need to become white boxes to see what is actually going on. Some problems are only solvable when you have such detailed information at hand.

Using WPT For Batch Script Profiling

$
0
0

Originally posted on: http://geekswithblogs.net/akraus1/archive/2013/01/17/151871.aspx

In the process of digging deeper into WPT I did find many new ways to explore my system. The Windows Performance Toolkit for Windows 8 is NOT only for Windows 8 but it does run on Windows Vista and later. This toolkit is the the Hubble Space Telescope of performance engineering. It gives you call stacks far far away in the kernel and back across  all processes of your system. But it is not only a tool for kernel hackers. You can use it also as an easy and free batch script profiler. It does not matter what you use (cmd, powershell, perl, ..) as long as your main work of the script does consist of calling one process after another.

When you want to install the Windows Performance Toolkit you get more infos here.

To start profiling your system you only need to execute 4 steps.

  1. Open a command prompt and do cd “C:\Program Files\Windows Kits\8.0\Windows Performance Toolkit”
  2. Now type xperf -on PROC_THREAD
  3. Execute your script
  4. Stop profiling and save the trace file to the defautl location: xperf –stop
  5. View the profiling information: wpa c:\kernel.etl

To show how the trace file does look like I have started several cmd.exe processes and stopped them to have something to graph. When I view the trace file with wpa.exe I do get this:

image

The graph shows on the x axis the time in seconds since you did start recording the trace. Every process start and stop with full command line information is recorded. The y-axis does contain the started processes so you can follow the timeline of your script and you can directly see which process has the longest bar which might be worth optimizing. I do show you this with xperf since for this very useful graph you do need to enable only the PROC_THREAD kernel provider. A list of the most useful providers is documented here. This allows you to capture long traces with very small trace files (about 1MB/min). WPA can handle trace files with decent performance up to 1GB. The other recording tools of WPT are WPR and the gui WPRUI which do enable myriads of kernel providers which logs trace data with a rate of ca. 1 GB/min on a busy system. That is not a suitable setup for taking data for some hours or even minutes.

It was never so easy to to benchmark your scripts as it is with WPT. The “old” xperf tool can do this stuff since many years but it was only known to driver developers. If you want to capture ETW events on a customer machine you do not need to install WPT on them for simple tasks. You can capture and save traces with logman.exe as well.


  1. Start Profiling:            logman create trace -ets "NT Kernel Logger" -o kernel_logman.etl -p "Windows Kernel Trace" (process)
  2. Stop Profiling:            logman stop -ets "NT Kernel Logger"
  3. View Captured Data: wpa kernel_logman.etl

This is the equivalent to our previous XPerf call. There seem to be many aliases built in into the tools which makes it a bit hard to find out what options I do actually need. But hey it does work. If you search for logman in your favorite search engine there are surprisingly few hits. It is time to change that. If it is so easy to profile your batch scripts these things should get more attention.

Semantic Tracing For .NET 4.0

$
0
0

Originally posted on: http://geekswithblogs.net/akraus1/archive/2013/06/02/153041.aspx

With Enterprise Library 6.0 which does only target .NET 4.5 we also have the power of semantic logging at our hands. The term semantic means that you do not log text messages but structured data aka objects which define specific actions in your application like startup, save, … which can be later more easily be parsed from that event stream. To make parsing and correlating activities easier is a noble goal in itself but there is a much bigger advantage when you embrace semantic logging with Enterprise Library. Now you can save your semantic logs to ETW (Event Tracing for Windows) and correlate your application activity with the system wide activities of all subsystems if you like. To pinpoint a bottleneck in disc IO, CPU, network in your or totally unrelated processes is now possible.

But what about .NET 4.0 or even .NET 3.5? You can write ETW events with these .NET versions as well but apparently no one did ever use it. The main issue with these earlier .NET versions is that you need to define an ETW manifest and register it in the system. Most .NET devs are unaware of ETW and did therefore not see the value of supporting this additional output channel. To create your own ETW manifest you need only to call ecmangen from the Windows SDK. I have created a simple manifest to route regular trace messages to ETW.

The Events section defines the logged data along with the defined task, keyword and other codes. The actual event data is defined in the Templates. For tracing there is not much structure except the timestamp, severity, message and the duration on method leave.

image

After you have defined the structure of your data now comes the nice part. You can generate C# or C++ code from the manifest directly! For this you need to call the

message compiler mc.exe. To create a static logger class in the namespace ApiChange.Tracing you can use:

mc -css ApiChange.Tracing ApiChangeTraces.man

There you have a source file named ApiChangeTraces.cs and a rc file which must be further converted to a true Win32 resource.

rc ApiChangeTraces.rc

will generate ApiChangeraces.res which can be consumed by any C# project where you can directly embed it.

image

That´s nearly it. The only thing left to do is to register the manifest to make Windows aware of your ETW events.

This is done with

wevtutil im ApiChangeTraces.man

To register a changed manifest again you first need to uninstall it with

wevutil um ApiChangeTraces.man before your can register it again.

One pesky thing does remain though. Your manifest does contain localizable resources so you need to write in your manifest! files the path to your executable before you can register the manifest successfully. At least environment variables are allowed. Your binary resources do not contain the manifest itself so you could in principle patch the manifest after installation of your application to the target path of your executable. Or you do copy your executable with the localized manifest resources to the configured location of the manifest.

<provider name="ApiChangeTracing" guid="{7D641D51-9BE4-4E27-A422-4832618146B5}" symbol="ApiChangeTracing" resourceFileName="%WINDIR%\Temp\SampleProvider.exe" messageFileName="%WINDIR%\Temp\SampleProvider.exe">

Now that we are ready to call into the generated code like this:

staticvoid Main(string[] args)
{for(int i=0;i<int.MaxValue;i++)
  {
    Console.WriteLine("Writing round: {0}", i);
    ApiChangeTracing.EventWriteTraceMethodEnter(DateTime.Now.ToString(), "SampleProvider.Program", "Main");
    ApiChangeTracing.EventWriteTraceInfo(DateTime.Now.ToString(), "Info Message " + i);
    ApiChangeTracing.EventWriteTraceWarning(DateTime.Now.ToString(), "Warning message " + i);
    ApiChangeTracing.EventWriteTraceError(DateTime.Now.ToString(), "Error message " + i);
    ApiChangeTracing.EventWriteTraceException(DateTime.Now.ToString(), "exception message " + i);
    ApiChangeTracing.EventWriteTraceMethodLeave(DateTime.Now.ToString(), "SampleProvider.Program", "Main", 300);
    Thread.Sleep(1000);
  }
}

No I do not propose to use DateTime as time measurement mechanism in tracing with an accuracy below 15.6ms. I did use it only for demo purposes here. You can define in your manifest not only strings but also dates which do work as well. Unfortunately the Windows Performance Analyzer UI could not decode ETW dates so I did stick to strings. In theory you can wait with the registration of your ETW provider until you need to enable it. This can be useful if you do want to allow non admin deployments for your application.

I use xperf to start and stop logging which is part of the Windows 8 SDK (it does work with Windows Vista+) as Windows Performance Toolkit. This does also include the viewer wpa.exe.To start tracing you need not only to enable your provider but also the kernel trace with at least PROC_THREAD so the viewer can gather information which process and thread did log this ETW event.

xperf -start apisession -on ApiChangeTracing -on PROC_THREAD

xperf -stop apisession -stop -d recording.etl

image

Ok that is nice but why not log to a simple text file? Well there are mainly two reasons. Did you see the vertical blue bar in the graph and the highlighted trace statement? Every trace call you do log does show up in the timeline of your traced data. If you want to check why your system does behave so sluggish after your application has been started you can find out know. You can enable more kernel providers to trace e.g. every context switch, file IO, network IO request. If you want to even with call stacks. That does give you a holistic view of the system across all processes at once.

Did you say call stacks? What about my own trace messages? Do I get them as well? Yes that is the second reason why you should consider writing an ETW provider. Every ETW event that is written can capture its call stack if you want to. There is no need in managed code to call new StackTrace or something similar. Windows will take care with its own super fast stack walking. This does work out of the box for unmanaged code. Managed stack walks are a little trickier.

First we need to enable stack walking for our trace provider:

xperf -start apisession -on ApiChangeTracing:::'stack' -on PROC_THREAD+LOADER

To capture managed stack frames we need to enable a CLR ETW provider to capture method and module offsets.

xperf -start ClrSession -on  e13c0d23-ccbc-4e12-931b-d9cc2eee27e4:0x98:5 -f clr.etl -buffersize 128 -minbuffers 256 -maxbuffers 512

The ClrSession does enable the provider Microsoft-Windows-DotNETRuntime by its guid with the keywords

  • LoaderKeyword 0x8
  • JITKeyword 0x10
  • EndEnumerationKeyword 0x80

and the level 5 which means verbose. The rest is only the declaration of the file and buffer sizes to tore the events.

Now you can execute your use case.

After that you need to start another CLR session which does collect the missing pieces:

xperf -start ClrRundownSession -on e13c0d23-ccbc-4e12-931b-d9cc2eee27e4:0x118:5+a669021c-c450-4609-a035-5af59af4df18:0x118:5 -f clr_DCend.etl -buffersize 128 -minbuffers 256 -maxbuffers 512

There we do add a second instance of the already running Microsoft-Windows-DotNETRuntime provider with

  • LoaderKeyword 0x8
  • JITKeyword 0x10
  • Not Documented 0x100

And the Microsoft-Windows-DotNETRuntimeRundown provider with

  • LoaderRundownKeyword 0x8
  • JitRundownKeyword 0x10
  • EndRundownKeyword 0x100

I am not sure why the 0x100 level in the DotNETRuntime provider is not documented.

Now we can stop and merge all open sessions into one to be able to correlate the traces and to store them in recording.etl

To create for NGenned assemblies the corresponding pdbs you need to do “set XPERF_CreateNGenPdbs=1”.That will trigger during the stopping of the session the creation of managed pdbs for all NGenned assemblies.

xperf -stop ClrSession ClrRundownSession apisession -stop -d recording.etl

You will notice that stopping and merging does take quite a while. The reason behind this is that xperf will (unlike logman) now create for all NGenned assemblies a matching pdb by calling NGen createpdb …. which does take a while when you have many NGenned assemblies. With .NET 4.5 this will happen much more frequently because of the automatic NGen feature where depending on its usage all often used assemblies are automatically NGenned. If you do not have set the _NT_SYMBOL_PATH environment variable xperf will create the pdbs in the folder C:\Symbols. If you have it set it will generate the pdbs in the first symbol download directory it does find.

Now you can view the generated traces with.

wpa recording.etl

You need to download the first time from Windows all kernel symbols. Later you can alter the symbol path to skip the time consuming search for symbols of your own modules. It does then suffice to configure

image

When you did all right then you can look at the call stacks of all trace calls.

image

That is a really nice thing. I admit that the manual steps are a bit involved but there is no one stopping you to automate these steps in a script to get full info at any time. As a matter of fact I did it for your and my convenience:

Record.cmd

@echo off
if "%1" EQU "-start" (
xperf -start ClrSession -on  e13c0d23-ccbc-4e12-931b-d9cc2eee27e4:0x98:5 -f "%temp%\clr.etl" -buffersize 128 -minbuffers 256 -maxbuffers 512
xperf -start apisession -on ApiChangeTracing:::'stack' -on PROC_THREAD+LOADER
goto :Exit
)
if "%1" EQU "-stop" (
xperf -start ClrRundownSession -on e13c0d23-ccbc-4e12-931b-d9cc2eee27e4:0x118:5+a669021c-c450-4609-a035-5af59af4df18:0x118:5 -f "%temp%\clr_DCend.etl" -buffersize 128 -minbuffers 256 -maxbuffers 512
set XPERF_CreateNGenPdbs=1
xperf -stop ClrSession ClrRundownSession apisession -stop -d "%temp%\combined.etl"
goto :Exit
)
if "%1" EQU "-view" (
wpa "%temp%\combined.etl"
goto :Exit
)

echo Usage:
echo Record.cmd -start or -stop  or -view
echo            -start Start a trace session
echo            -stop  Stop a trace session
echo            -view  View the collected traces

goto :Exit

:Exit


From this point on it is a small step to configure lightweight tracing by default and when you want to see more during an interesting use case you can even tracing dynamically. That does open a whole new world of possibilities. E.g. you can use this approach shown here to collect during performance regression tests profiling data with with your traces and all context switches and file IO. If you gather during all of your performance regression tests profiling data with very low impact it is much easier to diagnose sudden performance drops. You no longer need to repro the issue on two different baselines of your software. You can directly start analyzing the root cause of your performance issue. Perhaps it was SQL server hitting the disc, the virus scanner was active again or the defragmenter job was running. This way you can quickly check if the environment was not friendly during your test and the one random spike in your regression has a natural explanation.

So why wait for .NET 4.5 and Enterprise Library 6.0? You can take advantage of this stuff already today. You can also create your own parser to create custom views of the collected data. A very nice looking library is e.g. Linq to Traces which is used by SvcPerf to visualize WCF communication. Unfortunately this library does not give you call stacks yet. There is another library called TraceEvent which is used by PerfView which is able to generate the native images later. If you want to spare some time and collect only the data and you want to create the managed pdbs only when you really want to view the data you can create from this one a tool to do exactly that. It does also deal with the oddities of .NET 4.0 and 4.5 where are some differences how the managed pdbs are created.


Visualize Your Callstacks Via Flame Graphs

$
0
0

Originally posted on: http://geekswithblogs.net/akraus1/archive/2013/06/10/153104.aspx

I have found Bruce Dawson blog where he discusses the uses of Flame Graphs. Brendan Greg a Linux performance tool developer has created a nice perl script to render call stacks from a plain text file as a svg which can be viewed in all modern browsers. Bruce has used xperf with some undocumented switches to create a text extract of all call stacks. Then he used a python script to post process the generated file to make it compatible with the flamegraph perl script. I decided to make my own managed version of stack compressor which employs the TraceEvent library from Vance Morrison which gives you a powerful etl file parser. Below is an example of the generated graph after the perl script did post process it.

image

The x axis has no order but the width of the methods is proportional to the amount of used CPU time. The vertical axis shows the stack depth. If you hover with your mouse over the methods you get the full method name displayed. This is quite handy to get a different view of deeply nested stacks with many threads and or processes involved. The graph here makes it obvious that opening a file which is quite costly but closing the FileStream is also not cheap. Reading from the file is even cheaper than opening or closing it! This was a small sample app that did open and close one small file in an endless loop to get some interesting call stacks.

My TraceParser executable does take an etl file and prints out the call stacks from all processes from the complete etl file. You can limit the time range as well as the time range and a substring match which stacks are you interested in. To get from process 5200 all stacks you need to do:

TraceParser.exe C:\Users\Alois\AppData\Local\Temp\combined.etl * * 5200 > stacks.txt

flamegraph.pl stacks.txt > stacks.svg

It did take some time to get used to the TraceEvent library which is very powerful but also not so easy to use. I was constantly struggling with incomplete call stacks until I found that the default symbol resolver does only resolve some kernel symbols instead of everything.

public TraceLogOptions()
        {// These are the default modules to look up symbolically.  
            ShouldResolveSymbols = delegate(string moduleFilePath)
            {string moduleName = Path.GetFileNameWithoutExtension(moduleFilePath);if (string.Compare(moduleName, "ntdll") == 0 ||string.Compare(moduleName, "kernel32") == 0 ||string.Compare(moduleName, "ntkrnlpa") == 0 ||string.Compare(moduleName, "ntoskrnl") == 0)returntrue;returnfalse;
            };
        }

This was definitely not what I wanted. But ShouldResolveSymbols = (s) => true did the job. If you have problems with symbol loading you need to uncomment 

ConversionLog = Console.Out

to see file and symbol loading in action on the console. I do read from an etl file only the profile events which do contain a full call stack of a specific process and print the call stack with a weight of one to the console. When you download TraceEvent from Codeplex you need to get msdia100.dll for your target platform. You can make your life easy and simply copy the one provided by PerfView which is unpacked into your user profile at e.g. %USERPROFILE%\AppData\Roaming\PerfMonitor\VER.2013-01-09.06.49.30.000\x86 or the one provided by Visual Studio for x86. You need to deploy it besides TraceEvent.dll to enable it to pick it up.

Initially I did try to extract the stacks for a specific process with

var log = TraceLog.OpenOrConvert(file,new TraceLogOptions
    {
        AlwaysResolveSymbols = false,//   ConversionLog = Console.Out,
        ShouldResolveSymbols = (s) => true,
    });
Log = log;
var source = log.CPUStacks(null, false, (ev) => ev.ProcessId = xxxx);
source.ProduceSamples( (Diagnostics.Tracing.StackSources.StackSourceSample stack) =>
        {if (stack.StackIndex > 0 && (int)stack.StackIndex < Log.CallStacks.MaxCallStackIndex)
            {
                DumpCallStack(Log.CallStacks[(CallStackIndex)stack.StackIndex]);
            }
        });

But this did not filter the call stacks for a specific process out. I am not sure if I did miss anything but the many different enum types which are convertible or not into each other make it rather hard to switch from one object model (StackSample) to the CallStacks collection. In the end I did the filtering all by myself and it did work out quite nicely. Below is the final result of my experiment. The next step would be to visualize non profile events as well like context switch events. I am not sure yet how I can calculate from a context switch event (CSwitchTraceData) the CPU consumption. I only do see the wait time but what about the other time? The Flame graphs do provide a nice way to visualize CPU consumption across many call stacks at once. This could help in performance regression tests to identify changes in application logic which does consume more CPU than before. Wait times are unfortunately not captured but I am not sure if this would be very useful. With TPL we do tend to get quite wasteful with threads where many worker threads are waiting for work to arrive. When I visualize the wait times then I do see mainly the idle worker threads which is not useful.

What could be useful is to visualize the thread interaction and with ready events across the timeline. In principle it should be possible to create a logic chain why thread x did sleep for x ms and which thread did wake it up and to trace in the other thread back who did wake it up to get a sophisticated wait chain analysis how the threads do interact with each other. Not sure how reliable this would be but it certainly could be interesting. When one thread holds a lock and releases it while another thread was waiting for it it is immediately scheduled for execution by the OS scheduler. The likelihood that the ReadyThread is really the one which did wake my thread up is quite good but we would need to employ some other heuristics (like wait time and other hints) to see if we could print a thread interaction chart. The best thing would be of course that stuff like Flame Graphs and thread interaction visualization is already backed into WPT so we can all use it.

class Program
{
    TraceLog Log;int MinMs = 0;int MaxMs = int.MaxValue;int[] Pids = null;string[] Args;string CallStackSubstring = null;staticvoid Main(string[] Args)
    {new Program(Args).Run();
    }public Program(string[] Args)
    {this.Args = Args;
    }privatevoid Run()
    {if (Args.Length == 0)
        {
            Console.WriteLine("(c) by Alois 2013");
            Console.WriteLine("TraceParser does parse the full call stacks of all profile events to stdout which can be consumed");
            Console.WriteLine("by flamegraph.pl to generate a .svg file which can be rederend in the browser.");
            Console.WriteLine("No etl file specified.");
            Console.WriteLine("Usage: TraceParser <etl file> <startInMs> <stopInMs> <pid> <callStackSubstring>");
            Console.WriteLine("        startInMs, stopInMs and Pid can be replaced by * to not set any specific value for it");return;
        }string file = Args[0];if (Args.Length > 1)
        {if (Args[1] != "*")
            {
                MinMs = int.Parse(Args[1]);
            }
        }if (Args.Length > 2)
        {if (Args[2] != "*")
            {
                MaxMs = int.Parse(Args[2]);
            }
        }if (Args.Length > 3)
        {if (Args[3] != "*")
            {
                Pids = Args[3].Split(newchar[] { ',' }, StringSplitOptions.RemoveEmptyEntries)
                                .Select(int.Parse)
                                .ToArray();
            }
        }if (Args.Length > 4)
        {
            CallStackSubstring = Args[4];
        }

        Symbols.SymPath._NT_SYMBOL_PATH = @"c:\windows\symbols;C:\symbols;" + file + ".NGENPDB";
        var log = TraceLog.OpenOrConvert(file,new TraceLogOptions
            {
                AlwaysResolveSymbols = false,//   ConversionLog = Console.Out,
                ShouldResolveSymbols = (s) => true,
            });
        Log = log;if (Pids == null)
        {
            Pids = log.Processes.Select(p => p.ProcessID).ToArray();
        }foreach (var pid in Pids)
        {foreach(var ev in log.Processes.Single(x => x.ProcessID == pid)
                                                .EventsInProcess
                                                .ByEventType<SampledProfileTraceData>()
                                                .Where(ev => ev.TimeStampRelativeMSec > MinMs && ev.TimeStampRelativeMSec < MaxMs))
                {
                    DumpCallStack(Log.CallStacks[Log.GetCallStackIndexForEvent(ev)]);
                }
        }
    }privatevoid DumpCallStack(TraceCallStack traceCallStack)
    {if (traceCallStack == null)
        {return;
        }

        TraceCallStack current = traceCallStack;

        List<string> stacks = new List<string>();while (current != null)
        {if (current.CodeAddress != null)
            {// do not step into the kernel where drivers with .sys are on the stackif (current.CodeAddress.ModuleFileName.EndsWith(".exe") ||
                    current.CodeAddress.ModuleFileName.EndsWith(".dll"))
                {
                    stacks.Add(String.Format("{0}!{1}", current.CodeAddress.ModuleName, current.CodeAddress.FullMethodName));
                }
            }

            current = current.Caller;
        }

        if (this.CallStackSubstring != null)
        {// clear all stacks which do not contain our code if (!stacks.Any(x => x.Contains(CallStackSubstring)))
            {
                stacks.Clear();
            }
        }

        stacks.Reverse();

        if (stacks.Count > 0)
        {
            Console.WriteLine();
            Console.Write(String.Join(";", stacks));
            Console.Write(" 1");
        }
    }
}


.NET Code Evolution

$
0
0

Originally posted on: http://geekswithblogs.net/akraus1/archive/2013/07/24/153504.aspx

At my day job I do look at a lot of code written by other people. Most of the code is quite good and some is even a masterpiece. And there is also code which makes you think WTF… oh it was written by me. Hm not so bad after all. There are many excuses reasons for bad code. Most often it is time pressure followed by not enough ambition (who cares) or insufficient training. Normally I do care about code quality quite a lot which makes me a (perceived) slow worker who does write many tests and refines the code quite a lot because of the design deficiencies. Most of the deficiencies I do find by putting my design under stress while checking for invariants. It does also help a lot to step into the code with a debugger (sometimes also Windbg). I do this much more often when my tests are red. That way I do get a much better understanding what my code really does and not what I think it should be doing. This time I do want to show you how code can evolve over the years with different .NET Framework versions.

Once there was  time where .NET 1.1 was new and many C++ programmers did switch over to get rid of not initialized pointers and memory leaks. There were also nice new data structures available such as the Hashtable which is fast lookup table with O(1) time complexity. All was good and much code was written since then. At 2005 a new version of the .NET Framework did arrive which did bring many new things like generics and new data structures. The “old” fashioned way of Hashtable were coming to an end and everyone used the new Dictionary<xx,xx> type instead which was type safe and faster because the object to type conversion (aka boxing) was no longer necessary. I think 95% of all Hashtables and dictionaries use string as key. Often it is convenient to ignore casing to make it easy to look up values which the user did enter. An often followed route is to convert the string to upper case before putting it into the Hashtable.

        Hashtable Table = new Hashtable();void Add(string key, stringvalue)
        {
            Table.Add(key.ToUpper(), value);
        }

This is valid and working code but it has problems. First we can pass to the Hashtable a custom IEqualityComparer to do the string matching case insensitive. Second we can switch over to the now also old Dictionary type to become a little faster and we can keep the the original keys (not upper cased) in the dictionary.

        Dictionary<string, string> DictTable = new Dictionary<string, string>(StringComparer.OrdinalIgnoreCase);void AddDict(string key, stringvalue)
        {
            DictTable.Add(key, value);
        }

Many people do not user the other ctors of Dictionary because they do shy away from the overhead of writing their own comparer. They do not know that .NET has for strings already predefined comparers at hand which you can directly use.

Today in the many core area we do use threads all over the place. Sometimes things break in subtle ways but most of the time it is sufficient to place a lock around the offender. Threading has become so mainstream that it may sound weird that in the year 2000 some guy got a huge incentive for the idea to reduce the time to process calibration data from 12 hours to 6 hours by using two threads on a dual core machine. Threading does make it easy to become faster at the expense of correctness. Correct and scalable multithreading can be arbitrarily hard to achieve depending on the problem you are trying to solve.

Lets suppose we want to process millions of items with two threads and count the processed items processed by all threads. A typical beginners code might look like this:

        int Counter;
        void IJustLearnedToUseThreads()
        {
            var t1 = new Thread(ThreadWorkMethod);
            t1.Start();
            var t2 = new Thread(ThreadWorkMethod);
            t2.Start();

            t1.Join();
            t2.Join();

            if (Counter != 2 * Increments)thrownew Exception("Hmm " + Counter + " != " + 2 * Increments);

        }
constint Increments = 10 * 1000 * 1000;void ThreadWorkMethod()
        {for (int i = 0; i < Increments; i++)
            {
                Counter++;
            }
        }

It does throw an exception with the message e.g. “Hmm 10.222.287 != 20.000.000” and does never finish. The code does fail because the assumption that Counter++ is an atomic operation is wrong. The ++ operator is just a shortcut for

Counter = Counter + 1

This does involve reading the counter from a memory location into the CPU, incrementing value on the CPU and writing the new value back to the memory location. When we do look at the generated assembly code we will see only

inc         dword ptr [ecx+10h] 

which is only one instruction. Yes it is one instruction but it is not atomic. All modern CPUs have several layers of caches (L1,L2,L3) which try to hide the fact how slow actual main memory accesses are. Since cache is just another word for redundant copy it can happen that one CPU does read a value from main memory into the cache, modifies it and write it back to the main memory. The problem is that at least the L1 cache is not shared between CPUs so it can happen that one CPU does make changes to values which did change in meantime in the main memory. From the exception you can see we did increment the value 20 million times but half of the changes were lost because we did overwrite the already changed value from the other thread.

This is a very common case and people do learn to protect their  data with proper locking.


void Intermediate()
        {
            var time = Stopwatch.StartNew();
            Action acc = ThreadWorkMethod_Intermediate;
            var ar1 = acc.BeginInvoke(null, null);
            var ar2 = acc.BeginInvoke(null, null);
            ar1.AsyncWaitHandle.WaitOne();
            ar2.AsyncWaitHandle.WaitOne();if (Counter != 2 * Increments)thrownew Exception(String.Format("Hmm {0:N0} != {1:N0}", Counter, 2 * Increments));

            Console.WriteLine("Intermediate did take: {0:F1}s", time.Elapsed.TotalSeconds);
        }
        void ThreadWorkMethod_Intermediate()
        {for (int i = 0; i < Increments; i++)
            {lock (this)
                {
                    Counter++;
                }
            }
        }

This is better and does use the .NET Threadpool to get rid of manual thread management. It does give the expected result but it can result in deadlocks because you do lock on this. This is in general a bad idea since it can lead to deadlocks when other threads use your class instance as lock object. It is therefore recommended to create a private object as lock object to ensure that nobody else can lock your lock object.

When you read more about threading you will read about lock free algorithms. They are nice and can improve performance quite a lot but you need to pay close attention to the CLR memory model. It does make quite weak guarantees in general but it can still work because your CPU architecture does give you more invariants than the CLR memory model. For a simple counter there is an easy lock free alternative present with the Interlocked class in .NET. As a general rule you should not try to write lock free algos since most likely you will fail to get it right on all CPU architectures.

void Experienced()
        {
            var time = Stopwatch.StartNew();
            Task t1 = Task.Factory.StartNew(ThreadWorkMethod_Experienced);
            Task t2 = Task.Factory.StartNew(ThreadWorkMethod_Experienced);
            t1.Wait();
            t2.Wait();if (Counter != 2 * Increments)thrownew Exception(String.Format("Hmm {0:N0} != {1:N0}", Counter, 2 * Increments));

            Console.WriteLine("Experienced did take: {0:F1}s", time.Elapsed.TotalSeconds);
        }
void ThreadWorkMethod_Experienced()
        {for (int i = 0; i < Increments; i++)
            {
                Interlocked.Increment(ref Counter);
            }
        }

Since time does move forward we do not use threads explicitly anymore but the much nicer Task abstraction which was introduced with .NET 4 at 2010. It is educational to look at the generated assembly code. The Interlocked.Increment method must be called which does wondrous things right? Lets see:

lock inc    dword ptr [eax] 

The first thing to note that there is no method call at all. Why? Because the JIT compiler does know very well about CPU intrinsic functions. Atomic operations which do lock the memory bus to prevent other processors to read stale values are such things. Second: This is the same increment call prefixed with a lock instruction. The only reason for the existence of the Interlocked class is that the JIT compiler can compile it to the matching CPU intrinsic functions which can not only increment by one but can also do an add, exchange and a combined compare and exchange operation. But be warned that the correct usage of its methods can be tricky.

If you try to be clever and look a the generated IL code and try to reason about its efficiency you will fail. Only the generated machine code counts.

Is this the best code we can write? Perhaps. It is nice and clean. But can we make it any faster? Lets see how good we are doing currently.

LevelTime in s
IJustLearnedToUseThreadsFlawed Code

Intermediate

1,5 (lock)

Experienced

0,3 (Interlocked.Increment)
Master0,1 (1,0 for int[2])

That lock free thing is really a nice thing. But if you read more about CPU cache, cache coherency, false sharing you can do even better.

int[] Counters = newint[12]; // Cache line size is 64 bytes on my machine with an 8 way associative cache try for yourself e.g. 64 on more modern CPUsvoid Master()
        {
            var time = Stopwatch.StartNew();
            Task t1 = Task.Factory.StartNew(ThreadWorkMethod_Master, 0);
            Task t2 = Task.Factory.StartNew(ThreadWorkMethod_Master, Counters.Length - 1);
            t1.Wait();
            t2.Wait();

            Counter = Counters[0] + Counters[Counters.Length - 1];

            if (Counter != 2 * Increments)thrownew Exception(String.Format("Hmm {0:N0} != {1:N0}", Counter, 2 * Increments));

            Console.WriteLine("Master did take: {0:F1}s", time.Elapsed.TotalSeconds);
        }
void ThreadWorkMethod_Master(object number)
        {int index = (int) number;for (int i = 0; i < Increments; i++)
            {
                Counters[index]++;
            }
        }

The key insight here is to use for each core its own value. But if you simply use simply an integer array of two items, one for each core and add the items at the end you will be much slower than the lock free version (factor 3). Each CPU core has its own cache line size which is something in the range of 16-256 bytes. When you do access a value from one location the CPU does not only fetch one value from main memory but a complete cache line (e.g. 16 bytes). This means that you do not pay for the next 15 bytes when you access them. This can lead to dramatic performance improvements and non obvious code which is faster although it does have many more memory reads than another algorithm.

So what have we done here? We have started with correct code but it was lacking knowledge how to use the .NET Base Class Libraries optimally. Then we did try to get fancy and used threads for the first time and failed. Our next try was better but it still had non obvious issues (lock object exposed to the outside). Knowledge has increased further and we have found a lock free version of our counter which is a nice and clean way which is a perfectly valid solution. The last example is only here to show you how you can get most out of threading by paying close attention to your used data structures and CPU cache coherency.

Although we are working in a virtual execution environment in a high level language with automatic memory management it does pay off to know the details down to the assembly level. Only if you continue to learn and to dig deeper you can come up with solutions no one else was even considering. I have studied particle physics which does help at the digging deeper part. Have you ever tried to solve Quantum Chromodynamics equations? Compared to that the rest must be easy ;-). Although I am no longer working in the Science field I take pride in discovering non obvious things. This can be a very hard to find bug or a new way to restructure data to make something 10 times faster. Now I need to get some sleep ….

New Windows Performance Toolkit

$
0
0

Originally posted on: http://geekswithblogs.net/akraus1/archive/2013/08/03/153594.aspx

With Windows 8.1 a new version of the Windows Performance Toolkit has been released. There are many improvements in the WPA gui which were mostly shown during the Build Conference 2013. It is interesting to check what has changed in xperf as well. I simply did call xperf –help for all command line options  and write this to one text file. Then I can check the changes between WPA for Windows 8 and Windows 8.1.

xperf –help start

or -SetProfInt [<n>] [cached]

It seems that the profile interval can no longer be persisted for all following stack sampling etw sessions.


xperf –help stackwalk

For Windows 8.1 some new stackwalking capabilities were added

  • PmcInterrupt
  • PagefaultCopyOnWrite
  • PageAccessEx
  • PageRemovedfromWorkingSet


xperf –help processing

  • drips            Show Connected Standby statistics
  • regions          Show regions statistics
  • screenshots      Show the screenshots recorded in the trace

The last thing screenshots is interesting. I do wonder which ETW Event I must create to store a screenshot in my ETW trace file. It is a cool idea to store screenshots in your etl. Now you can find “obvious” reasons why a performance regression test went bad because e.g. a popup from the graphics card driver was blocking your use case. Before that you needed to figure out from the call stack that some messagebox which did never go away was blocking your call.


One big improvement is that you can extract the table contents of WPA not only via Cut&Paste but via a dedicated exporter tool which takes your .etl file and a .wpaProfile view which defines the tables you want to export into .csv files. Previously I had to wait for minutes until the cut and then wait minutes again after the paste operation was completed for bigger tables with call stacks. This caused funny bugs inside Windows in itself which caused Windows to stop responding to all following cut and paste operations. You can select a specific time region or the time between two ETL Marker events which can help tremendously during automated performance regression testing.

The exporter tool is called wpaexporter.exe which uses the view you see in WPA which can be exported as .wpaProfile files. I have saved some tables in (via Export Profile menu) disc.wpaProfile. Then I can generate csv files of my etl file by

wpaexporter -profile disc.wpaProfile -prefix disc_ -i heapusage.etl

This will give me for each table an extra csv file like

disc_CPU_Usage_(Attributed)_Utilization_by_Process,_Thread,_Activity.csv
disc_CPU_Usage_(Precise)_Context_Switch_Count_by_Process,_Thread.csv
disc_CPU_Usage_(Precise)_Context_Switch_Rate_by_CPU.csv
disc_CPU_Usage_(Precise)_Timeline_by_CPU.csv
disc_CPU_Usage_(Precise)_Timeline_by_Process,_Thread.csv
disc_CPU_Usage_(Precise)_Usage_by_Priority_at_Context_Switch_Begin.csv
disc_CPU_Usage_(Precise)_Utilization_by_CPU.csv
disc_CPU_Usage_(Precise)_Utilization_by_Process,_Thread.csv
disc_CPU_Usage_(Sampled)_DPC_and_ISR_Usage_by_Module,_Stack.csv
disc_CPU_Usage_(Sampled)_Utilization_By_CPU.csv
disc_CPU_Usage_(Sampled)_Utilization_By_Priority.csv
disc_CPU_Usage_(Sampled)_Utilization_by_Process,_Stack.csv
disc_CPU_Usage_(Sampled)_Utilization_By_Process.csv
disc_CPU_Usage_(Sampled)_Utilization_By_Process_(1).csv
disc_CPU_Usage_(Sampled)_Utilization_By_Process_and_Thread.csv

Now I can generate graphs and filters or my own analysis tool from the generated csv files.

image

Here for example I did print the IO size and IO time for normal and low IO priority. Although svchost has very high IO times it does read less than 30%  of the data of Visual Studio which has much smaller IO times. The reason is that the svchost does host Windows Defender which does all reads at low IO priority to get out of the way or “normal” applications which seems to work out quite good. This would have been difficult to see in WPA

The WPA tool has undergone a small facelift to give you even more graphs than before and to allow you to compare two tables of the same or different etl files. This is great for regression to see where the changes might hide. There have been some new graphs added as well. Here are the ones you will usually see

 imageimageimage

The Disk Offset graph has left its hidden place in the context menu which does allow you to see why you have crappy disc IO because of many disc seeks. This graph gives you a direct view how much seeks the hdd did need to write/read your file/s. It does not make much sense for solid state discs of course. A really useful graph is Throughput by Process which gives you direct numbers how much data your app was able to process.

Recently I have played with ways to clone ADAM instances to speed up integration testing. The idea was to fill in the configuration data already during build time and later deploy the already filled ADAM instances to it. The only problem was that there is no MS supported quick way to transfer ADAM instances between different computers by simply copying the adamntds.dit file to the test machines. A few days later I did install configuration data as usual but I noticed a severe performance loss on my machine. The data import did not take 4 minutes but 12 minutes now! At first I thought it had something to do with my platform (x86 Debug) but it was equally slow in x64 Release. I had no idea what was going on. When using WPA I did see that my disc was maxed out during the data import process which is not unusual since DBs want to make sure that their stuff is written to disc. Unfortunately I had no run of a fast import as ETL file to compare them. By looking at the event logs there were no errors and everything was working as expected. Something quite fundamental must have been changed but what? Perhaps ADAM did remember that I tried to copy around the database files on my machine and it was operating in some safe mode now. By looking at the call stacks I did see some strange methods but I was not sure if ADAM was operating in a different mode. As last resort I tried to move the ADAM instance to a different drive and started the import from there. The import speed was back to normal! So my C drive must have some problem. I have not found any hardware events in the System or Application event logs for any suspicious SMART events which would tell me that my drive is dying. But WPA can show you the complete system configuration for your machine as well:

clip_image002

Now I can see the difference. Someone must have disabled Write Caching for my C drive! I can only guess how this could happen. I do remember that dsamain.exe which does host one ADAM instance did crash once. Perhaps it did disable write caching for my drive while dying to make me remember not to mess around with databases. Now we can look at a 20s time interval during a slow import

clip_image002[5]

and now again for a fast import

clip_image002[7] 

Both disc utilization graphs show a busy hard disc but when we look at the new Throughput by Process graph it is clear that we are importing much more data than before. A nice thing of the new WPA tool is that you can scale the y-axis to your needs to get comparable scales for different graphs.

Now I only needed to go back to the device manager and enable write caching for my C drive. But I have also learned the hard way that the DB import is IO bound. I have always wondered why the dsmain process never got above 3-4% of CPU utilization while hammering it with data. I did suspect some internal locking in ADAM but MS support did tell me that this was not the case. So I tried to use something faster. What can be faster than a RAM disc? I have tried the top Google hit and installed it on my machine. Since my ADAM Instance takes needs ca. 200MB there is plenty of free space on a 500MB RAM disc. When trying the configuration data import on the RAM disc I did see for the first time that the dsamain process did fully utilize one core with 100%. The import time went down from 4 minutes to 1 minute which is a major achievement. After seeing these numbers I did decide that it is much better to use a RAM drive for the test machines than to try to copy around prefilled database instances which need to be created, filled, copied and checked if they do run at the test machine at all. I am pretty sure that since Windows XP and Windows 8 the binary format of the database has changed several times which would make db cloning of limited use anyway.

For tests I do not need a reliable data store. The RAM is good enough. For developers setting up their machine it is a little different. They do reboot from time to time but they do certainly not want to reinstall configuration data after every reboot. Luckily some RAM discs do sync the data during shutdown or at configurable time intervals to disc. The RAM disc is therefore a good solution for everyone except for the customers which do not want to have their configuration values in memory and potentially never written to disc.

It is great to have such tooling from MS available. With the WPA performance microscope we can understand much better where the performance is hiding. And we can make informed decisions which approach is better and why. Previously it was all guessing: “We can get faster by cloning the database”. After learning what the database import actually slowed down I was able to make it faster by a factor 3 without going into unsupported regions by copying database files around.

How To Persist CPU and IO Priority For A Process

$
0
0

Originally posted on: http://geekswithblogs.net/akraus1/archive/2013/08/14/153728.aspx

Recently I have looked at the system startup time of my PC which does have a quite high boot time. Luckily WPR from the Windows Performance Toolkit does allow you to capture boot traces without much effort. You only need to select Boot as Performance scenario and the number of boots you want to perform to capture data. The default is three which I normally reduce to one because I have no regression test going on.

image

Then you can easily check if a script of your administrators did take too long. Or if the virus scanner is getting out of hand by causing too much disc IO. One thing I did notice on my machine was that a system service was stopped, deleted and created again. While deleting a service the sc delete call did hang for 70s because Windows did think that the service was still starting up and did give up only after quite a long time. After that was fixed a netsh call did hang also for 70s which did try to disable IPv6 but only after the IPv6 subsystem was started. Besides these two hangs my boot was practically disc bound. So I did look which processes do hit the disc hard but delay other more important tasks. One obvious thing was some monitoring software which does read quite a lot of data during boot. Since Windows does support IO priorities and you can change them with tools like Process Hacker (it is better than Process Explorer from SysInternals for many tasks). I thought it would help a bit to lower the CPU and IO priority of some unimportant processes during the boot phase to get faster to my desktop. There are many tools out there to change the priorities of running processes but there are very few tools out there to persist it automatically once a process is started. Process Hacker for example can remember for a specific process the settings and reapply it when it is running. But during the boot no tool like process hacker is running. There are other commercial tools out there which seem to do the same thing but since I am a programmer I can write my own tool.

My own tool? No. I was just kidding. Who needs a tool? This functionality is already baked into Windows since Windows Vista! I have found surprisingly little information about this feature on the net. But here it is. The Registry Key is Image File Execution Options where you can set the CPU and IO priority for an executable manually. You only need to create a registry key like

HKEY_LOCAL_MACHINE\SOFTWARE\Microsoft\Windows NT\CurrentVersion\Image File Execution Options\cmd.exe\PerfOptions

In the example above I want to set for cmd.exe the CPU and IO priority. For this I do need to set two DWORD values named CpuPriorityClass and IoPriority below the PerfOptions key. With a little bit experimentation I have found the values which do something:

CpuPriorityClass ValuePriority
1Idle
2Normal
3High
5Below Normal
6Above Normal

IoPriority ValuePriority
0Very Low
1Low
2Normal

All other values set the priority back to normal. This should help to get a few more seconds out during the boot phase. I can only speculate why MS did not document these settings. As usual it is dangerous to tinker with priorities because the OS Scheduler might never schedule any IO or CPU time slice for a process when other processes with higher priorities are constantly running. Besides that if too many processes use this feature it becomes quickly useless which might be the main reason not to document it. Too many people will misuse such features to shoot themselves in the foot and later complain that there was not safety warning message box telling them to not shoot themselves in the foot. If you know that you are doing unimportant stuff you should use the Windows APIs to set your process into background processing mode which will lower the CPU and IO priority for for the whole process. Additionally there exists  SetThreadPriority which does the same for only one thread inside your process. But you should be aware of the fact that your stuff might never run if there is constant load on the machine with more important tasks.

From Console.WriteLine To ETW

$
0
0

Originally posted on: http://geekswithblogs.net/akraus1/archive/2013/08/21/153804.aspx

When I do start a new project for a small tool I do sprinkle throughout my code some Console.WriteLine calls to see what is going on and to report errors. I am quite sure that 99% of all developers work this way except for the TDD elite which do start with a MEF container and injectable tracer and logger interfaces right from the beginning. When the tool proves to be useful it is extended a little bit here and there and other people start using it. Perhaps it is used in a script or it is put in an Run key to be started every time the user does log on or it does get a nice WPF UI…

Errors do still happen but the Console output does go nowhere now. If you e.g. switch from a Console Application project type to a Windows Application in the Visual Studio project settings there is no hidden magic going on. The project type is a simple tag in the PE file which does nothing for a console app and for a Windows application it does upon start detach from the console (if any) it was started from to free the command prompt for the next application you want to start. When your users report problems with your tool you have just lost your console output you did rely on. At this point you do tell the users to switch on tracing and to log the data to a file with the hidden –debug switch your application surely has. But for this to happen you need to take an extra library dependency or to copy quite a bit of code into your still small project and you need to exchange all Console.WriteLine calls with calls to your tracing library. That is overkill for many small tools which are useful because they to spare enough time to justify the time spent on coding them.

Before you throw out your Console.WriteLine calls to get your diagnostics abilities back  you can sidestep the problem by redirecting the Console.Out TextWriter instance to your own intercepting TextWriter instance. You can still print to the console but you can now easily write the output to a secondary (or even tertiary) location. It can be a log file or an ETW TraceListener or the diagnostics window in your WPF application. The following example shows how to write your console output to ETW with jus a few additional lines of code.

using Microsoft.Diagnostics.Tracing;using System;using System.IO;using System.Text;using System.Threading;namespace ConsoleRedirector
{class Program
    {staticvoid Main(string[] args)
        {// Simply wrap your Main method with this using statement and all output goes to // ETW, DebugOutput or a log file without the need to touch or change existing Console.WriteLine callsusing (new ForwardWriter(WriteToETW, WriteToETW))
            {for (int i = 0; i < 1000; i++)
                {
                    Console.WriteLine("Writing event {0}", i);
                    Thread.Sleep(1000);
                }
            }
        }staticvoid WriteToETW(string line)
        {
            ConsoleEventSource.Log.Write(line);
        }/// <summary>/// Forward Console.Write and Console.WriteLine calls to your handler to redirect them to alternate locations/// </summary>class ForwardWriter : TextWriter
        {/// <summary>/// Original TextWriter from Console.Out/// </summary>
            TextWriter Orig;/// <summary>/// Redirect Console.Out with this instance and forward Console output to passed handlers./// </summary>/// <param name="onWrite">Receives strings from Console.Write</param>/// <param name="onWriteLine">Receives strings from Console.WriteLine</param>public ForwardWriter(Action<string> onWrite, Action<string> onWriteLine)
            {
                Orig = Console.Out;
                Console.SetOut(this);if (onWrite != null)
                {
                    OnWrite += onWrite;
                }if (onWriteLine != null)
                {
                    OnWriteLine += onWriteLine;
                }
            }/// <summary>/// Create a new forwarder. To receive the output you need to subscribe to the events OnWrite and OnWriteLine/// </summary>public ForwardWriter()
                : this(null, null)
            {
            }/// <summary>/// Is fired when Console.Write call happened/// </summary>publicevent Action<string> OnWrite = (str) => { };/// <summary>/// Is fired when Console.WriteLine call happened/// </summary>publicevent Action<string> OnWriteLine = (str) => { };publicoverride Encoding Encoding
            {
                get { thrownew NotImplementedException(); }
            }/// <summary>/// All overloads of Console.WriteLine do call finally this overload /// </summary>/// <param name="value"></param>publicoverridevoid WriteLine(stringvalue)
            {
                Orig.WriteLine(value);
                OnWriteLine(value);
            }/// <summary>/// All overloads of Console.Wrie do call finally this overload/// </summary>/// <param name="value"></param>publicoverridevoid Write(stringvalue)
            {
                Orig.Write(value);
                OnWrite(value);
            }
        }/// <summary>/// ETW event provider for redirected Console messages/// </summary>
        [EventSource(Name = "ConsoleLog", Guid="{7B25937F-14D7-4BFF-BD7D-2A0C00ABA1EE}")]sealedclass ConsoleEventSource : EventSource
        {publicstatic ConsoleEventSource Log = new ConsoleEventSource();/// <summary>/// Write a console message/// </summary>/// <param name="Message"></param>publicvoid Write(string Message)
            {
                WriteEvent(1, Message);
            }private ConsoleEventSource():base(true)
            { }
        }
    }
}

Now you can leave your precious Console.WriteLine calls in your code and you still can get full diagnostic by forwarding your output to ETW or a simple log file by adding a simple using statement to your Main method. This is of course not perfect but for small tools it is often enough to get the job done. The ETW writer does not only work with .NET 4.5 but you can also Target .NET 4.0 apps if you get the Microsoft.Diagnostics.Tracing.EventSource package via Nuget (be sure to check beta packages) which does target .NET 4.5 but it does work with .NET 4.0 as well. The nice thing about ETW is that you can enable it for an already running application and you get the full output without any registration steps. The ETW Provider introduced with .NET 4.5 does create from the declaring class via reflection


With the Windows Performance Toolkit you can capture with WPR by creating your own profile to capture your ETW events with a wprp file like

<?xmlversion="1.0"encoding="utf-8"?><WindowsPerformanceRecorderVersion="1.0"><Profiles><EventCollectorId="EventCollector_MyEventSource"Name="ConsoleTraces"><BufferSizeValue="1024"/><BuffersValue="200"/></EventCollector><EventProviderId="ConsoleEventSource"Name="7B25937F-14D7-4BFF-BD7D-2A0C00ABA1EE"/><ProfileId="ConsoleTraces.Verbose.File"Name="ConsoleTraces"Description="Console Traces"LoggingMode="File"DetailLevel="Verbose"><Collectors><EventCollectorIdValue="EventCollector_MyEventSource"><EventProviders><EventProviderIdValue="ConsoleEventSource"/></EventProviders></EventCollectorId></Collectors></Profile><ProfileId="ConsoleTraces.Verbose.Memory"Name="ConsoleTraces"Description="Console Traces"Base="ConsoleTraces.Verbose.File"LoggingMode="Memory"DetailLevel="Verbose"/></Profiles></WindowsPerformanceRecorder>

image

As you can see the provider name is derived from the EventSource Name attribute, the Task Name is the called method and the Message field is the parameter name passed to to the Write method. This magic is only possible because this ETW provider does create an ETW manifest file via reflection from your class, method and method parameters which is written an an extra ETW event to the etw event stream which is later parsed by WPA to make this nice visualization possible.

You can create from your class also a “classic” ETW manifest file which you can register with wevtutil –im xxx.man as usual. You can get the manifest string via

EventSource.GenerateManifest(typeof(ConsoleEventSource), Assembly.GetExecutingAssembly().Location)

from where you can save the returned string to a file and register it. The beta NuGet package seems to have problems because it did not work and did throw a NullReferenceException inside it. But the .NET 4.5 EventSource class in mscorlib does work as expected.

For the simple ETW provider I do get this manifest:

ConsoleTraces.wprp

<instrumentationManifestxmlns="http://schemas.microsoft.com/win/2004/08/events"><instrumentationxmlns:xs="http://www.w3.org/2001/XMLSchema"xmlns:xsi="http://www.w3.org/2001/XMLSchema-instance"xmlns:win="http://manifests.microsoft.com/win/2004/08/windows/events"><eventsxmlns="http://schemas.microsoft.com/win/2004/08/events"><providername="ConsoleLog"guid="{7b25937f-14d7-4bff-bd7d-2a0c00aba1ee}"resourceFileName="D:\Media\Blog\ConsoleRedirector\ConsoleRedirector\bin\Debug\ConsoleRedirector.exe"messageFileName="D:\Media\Blog\ConsoleRedirector\ConsoleRedirector\bin\Debug\ConsoleRedirector.exe"symbol="ConsoleLog"><tasks><taskname="Write"value="65533"/></tasks><opcodes></opcodes><events><eventvalue="1"version="0"level="win:Informational"task="Write"template="WriteArgs"/></events><templates><templatetid="WriteArgs"><dataname="Message"inType="win:UnicodeString"/></template></templates></provider></events></instrumentation><localization><resourcesculture="de-DE"><stringTable></stringTable></resources></localization></instrumentationManifest>

These embedded manifests have he benefit that you do not need to be an administrator to register the manifest in the system. But since you do not have registered your provider it will also no longer show up as registered ETW provider (xperf –providers).

Instead of a .wprp file you can also directly call xperf to collect your traces. To enable stackwalks every 1ms and full managed call stacks you need this xperf calls to enable profiling:

xperf -start ClrSession -on e13c0d23-ccbc-4e12-931b-d9cc2eee27e4:0x98:5  -f "%temp%\clr.etl" -buffersize 128 -minbuffers 256 -maxbuffers 1024 -on LOADER+PROC_THREAD+PROFILE -stackwalk Profile -f "%temp%\kernel.etl" -buffersize 128 -minbuffers 256 -maxbuffers 2048
xperf -start TraceSession -on 7B25937F-14D7-4BFF-BD7D-2A0C00ABA1EE -f "%temp%\traces.etl" -buffersize 128 -minbuffers 256 -maxbuffers 1024


To stop tracing you need to call

xperf -start ClrRundownSession -on e13c0d23-ccbc-4e12-931b-d9cc2eee27e4:0x118:5+a669021c-c450-4609-a035-5af59af4df18:0x118:5 -f "%temp%\clr_DCend.etl" -buffersize 128 -minbuffers 256 -maxbuffers 512
set XPERF_CreateNGenPdbs=1
set _NT_SYMBOL_PATH=srv*%TEMP%\combined.etl.NGENPDB
xperf -stop TraceSession ClrSession ClrRundownSession -stop -d "%temp%\combined
.etl"

It is a bit cumbersome but you can easily create a batch script to collect only the data you actually want. If you use the WPRUI tool it will not only collect the configured data but it will collect CPU and Disk activity always which does generate quite a lot of data. But if you use the command line tool then you collect only what you did specify in the wprp file. Then you only need to execute:

wpr -start consoleraces.wprp

wpr -stop traces.etl

to get your hands on your data. Although nice it is still problematic for installed machines on customer sites where you are usually not allowed to install additional software to find the bug. This is often the case in clinical environments where data integrity is taken really serious. It would help to make the WPR tool open source so it is possible to deliver the ETW recording tool along with the product software which is currently not possible since the ADK license does not permit to redistribute any part of it. You can resort back to logman for simple cases but if you want to enable managed stackwalks you need xperf or related tools to make it work.

Viewing all 682 articles
Browse latest View live